PE / DS / 01
Python masterclass
Python from zero before any data library.
Open the syllabusPeru · Data science · Live online, in English · 14 to adult
Most data science courses start with a clean file and a model. Real work starts earlier, with a question nobody likes: can this data answer what we are asking? This page explains what a data science course should teach, where Peruvian open data comes from, and walks through an analysis of eight years of hourly weather near Huancayo in which the most interesting result turns out to be a warning.
Live classes since 2020 · 10,000+ learners worldwide · real data from the first month
The short answer
Modern Age Coders teaches data science to learners in Peru live online and in English: adults and university students from 18 start with Python, then learn pandas, statistics, visualisation and machine learning, and teenagers from 14 who know some Python have their own course. We work on real open data, including Peruvian datasets, and teach learners to question a dataset before trusting a result. A mentor is on video in every class, with a group of fifteen to twenty or one to one, at any day and hour you choose.
Start here
A complete route for adults, a shorter route for teenagers, and an analysis-first route for people whose work lives in spreadsheets.

PE / DATA / 01
For complete beginners from 18, 10 to 12 months. Python first, then data handling, statistics, machine learning and a capstone on real data.
Open the syllabus →
PE / DATA / 02
Ages 14 to 18 who know basic Python, six months. Charts, real datasets and first models, built and explained by the student.
Open the syllabus →
PE / DATA / 03
For beginners from 18, 8 to 10 months. The route for analysts: from spreadsheets to SQL, Python and dashboards.
Open the syllabus →The work
Less modelling than people expect, and much more checking. A data science course that skips the checking produces people who can run a model and cannot tell when its answer is nonsense.
Turn a vague request, "are frosts getting worse?", into a question the data could answer: which months, which hours, which threshold, compared with what.
Open the file and look before computing. Blanks, units, duplicates, a column whose meaning changed halfway through. This step takes the longest and is taught the least.
Summaries, charts, statistical tests and, where they earn their place, models. Each result written in a sentence a manager could repeat without misquoting it.
Python as a language first, so learners can write their own checks instead of hunting for a library function. Then pandas for tables, charts with matplotlib, descriptive statistics, probability, sampling and hypothesis tests, and finally machine learning with scikit-learn and an introduction to deep learning.
Running through all of it is the habit this page's lesson is about: looking at the data from more than one side before believing a number.
Data science needs school algebra, comfort with percentages and averages, and then statistics and some linear algebra taught as needed. Peruvian school maths already includes a competency on managing data and uncertainty, "gestión de datos e incertidumbre", in MINEDU's national curriculum, so many learners have met the ideas without the code.
If your maths is rusty, we have a separate course on the mathematics of data science, listed further down the page.
Our Spanish page, curso de data science en inglés, starts from the spreadsheet, uses a university enrolment dataset from Huánuco and teaches how a fake zero distorts an average. Here we take a weather dataset and a different trap.
Peruvian data
On the Plataforma Nacional de Datos Abiertos, datosabiertos.gob.pe, where ministries, regional governments, municipalities, universities and institutes publish datasets, most of them under an open licence. Our lesson uses one from the Instituto Geofísico del Perú.
| Field | What the dataset page says |
|---|---|
| Publisher | Instituto Geofísico del Perú (IGP) |
| Station | Automatic weather station at the Huancayo Observatory, Huayao, Junín |
| Position | 12.0401 south, 75.32049 west, 3,329 metres above sea level |
| Frequency | Hourly |
| Period | 1 January 2018, 00:00, to 31 December 2025, 23:00 |
| Temperature (TT) | Air between 1.25 and 2 metres above the ground, in degrees Celsius |
| Other columns | Humidity (%), rain (mm), pressure (hPa), wind speed (m/s) and direction (degrees) |
| Released and modified | Released 30 May 2025; last modified 29 May 2026 |
| Licence | Open Data Commons Attribution License (ODC-By) |
Source: Plataforma Nacional de Datos Abiertos, dataset "Estación Meteorológica Automática para variables atmosféricas de LAMAR, Junín, Perú" by the IGP, read and downloaded on 9 November 2026. The file has 70,128 rows of data, one for every hour of the eight years; counts are ours.
The Open Data Commons Attribution License lets anyone copy, analyse and publish work built on the data, provided the source is credited. That is why every chart in our lesson names the IGP and the licence, and why our learners are taught to write the credit line before the first chart, not after.
Not every Peruvian dataset uses the same licence, so checking it is the first step of any project, alongside reading the data dictionary.
The observatory sits in the Mantaro valley, outside the city of Huancayo, which had 456,250 people at the 2017 census, in the department of Junín, counted at 1,422,780 in the 2025 census. Cold mornings in the dry months are part of life in the valley.
An hourly temperature record is also a perfect teaching file: easy to understand, big enough to need code, and, as we found, complicated in a way nobody warns you about.
A real analysis
A simple question for the IGP file: how many nights a year did the temperature drop below zero? The first answer is dramatic. The second program shows why a data scientist should not publish it.
For every day, the program finds the lowest hourly temperature, then counts the days whose lowest reading is below 0 °C, year by year. Blank readings are skipped, which is the right thing to do with a blank.
The output shows no frost at all in 2018, 2019 and 2020, then between 26 and 48 frost nights in every year from 2021. Read naively, frost appeared out of nowhere.
Weather does not usually switch on like that. A station at more than 3,300 metres with no sub-zero hour in three whole years, followed by dozens of frost nights every year after, is a pattern that deserves suspicion before it deserves a headline.
So the mentor asks the class one question: if the cold had truly changed, what else in the data would have changed with it?
import csv

FILE = "IGP_EstacionEMA_data_2018_2025.csv"

coldest = {}                                  # (year, month, day) -> lowest TT
with open(FILE, encoding="utf-8") as f:
    for row in csv.DictReader(f):
        if row["TT"] == "":
            continue
        day = (row["year"], row["month"], row["day"])
        coldest[day] = min(coldest.get(day, 99.0), float(row["TT"]))

frost = {}
for (year, month, day), low in coldest.items():
    if low < 0:
        frost[year] = frost.get(year, 0) + 1

for year in range(2018, 2026):
    print(year, "frost nights:", frost.get(str(year), 0))
Run from the folder holding the downloaded file, it prints 2018 frost nights: 0, 2019 frost nights: 0, 2020 frost nights: 0, then 2021 frost nights: 29, 2022 frost nights: 40, 2023 frost nights: 48, 2024 frost nights: 26 and 2025 frost nights: 29.
If winters really got colder, the number of cold hours would rise too, not only the hours below zero. Version 2 counts, for June and July of each year, every hour under 3 °C, and how many of those were under 0 °C. It also finds the first sub-zero reading in the whole file and counts the blanks.
import csv

FILE = "IGP_EstacionEMA_data_2018_2025.csv"

cold = {}       # year -> hours under 3 °C in June and July
below = {}      # year -> of those, hours under 0 °C
blank = 0
first_negative = None
with open(FILE, encoding="utf-8") as f:
    for row in csv.DictReader(f):
        if row["TT"] == "":
            blank += 1
            continue
        t = float(row["TT"])
        if t < 0 and first_negative is None:
            first_negative = (row["year"], row["month"], row["day"], row["hour"])
        if row["month"] in ("6", "7") and t < 3:
            cold[row["year"]] = cold.get(row["year"], 0) + 1
            if t < 0:
                below[row["year"]] = below.get(row["year"], 0) + 1

print("blank TT readings:", blank)
print("first reading below 0:", first_negative)
for year in range(2018, 2026):
    y = str(year)
    print(y, "hours under 3 C:", cold.get(y, 0), "of which under 0 C:", below.get(y, 0))
It prints blank TT readings: 700 and first reading below 0: ('2021', '5', '27', '4'), then one line per year, from 2018 hours under 3 C: 243 of which under 0 C: 0 to 2025 hours under 3 C: 276 of which under 0 C: 126.
| Year | Hours under 3 °C | Of which under 0 °C |
|---|---|---|
| 2018 | 243 | 0 |
| 2019 | 270 | 0 |
| 2020 | 222 | 0 |
| 2021 | 226 | 75 |
| 2022 | 306 | 121 |
| 2023 | 349 | 150 |
| 2024 | 259 | 100 |
| 2025 | 276 | 126 |
Data: Instituto Geofísico del Perú, Estación Meteorológica Automática, Huancayo Observatory, Huayao, via the Plataforma Nacional de Datos Abiertos, Open Data Commons Attribution License (ODC-By). Counts are our own, computed on 9 November 2026 with the programs above.
The cold hours do not jump in 2021. They wander between 222 and 349 a season across all eight years. What jumps is the share of them below zero: none for three years, then a large share every year. In the earlier years, the coldest July reading never went lower than about 0.2 °C, and the first negative value in the whole file appears on 27 May 2021. That pattern fits a change in how temperatures were recorded or processed at least as well as it fits a change in the weather.
We have not asked the IGP, and this page does not claim to know the cause. That is the point of the lesson. The honest report says: "In this file, sub-zero readings begin in May 2021; the number of cold hours did not change in the same way; before comparing frost across that date, confirm with the publisher whether the sensor or processing changed." A data scientist who writes that sentence has done more useful work than one who fits a trend line to the first output.
A route of our own
For a beginner with school maths, about a year to work confidently on real data with a mentor's review. Here is the route we usually suggest.
| Stage | Focus | Evidence at the end |
|---|---|---|
| First | Python as a language | Small programs that read a CSV file without pandas, like the ones above |
| Second | pandas and charts | A cleaned dataset and five charts, each with a one-sentence finding |
| Third | Statistics and probability | A comparison with a stated uncertainty, not just two averages |
| Fourth | Machine learning | A model, its baseline and an honest test on unseen data |
| Final | A capstone on open data | A report a non-specialist can read, with sources and licence |
Our plan, adjusted to each learner. Our main adult course runs 10 to 12 months from zero; the teen course is six months for learners who already know basic Python. We make no job or salary promises.
Teenagers from 14 who already write basic Python can take the teen data science course: real datasets, charts and first models. Younger learners or those new to code start with Python first.
For a teenager or adult who has never coded, the Python course page, in Spanish, explains how Python starts from zero.
University students in Peru often meet data in lab courses and numerical methods before they meet it in a data science course. If that is you, our page on Python for engineering students covers that path.
From there, the step to data science is mostly statistics and judgement, which is where we spend the most class time.
Language of the classes
No. All our classes are live, online and given in English, by mentors based in India who match their pace to the learner.
Mentors speak calmly, define each new term the first time it appears and check understanding before moving on. A learner who is unsure can ask again, in any words they have, and the explanation changes shape until it lands.
The libraries are English: pandas, NumPy, scikit-learn and their documentation, error messages and forums. So are most research papers and data dictionaries outside Peru.
EF's English Proficiency Index 2025 scores Huancayo at 499, in EF's low band, and Lima at 555, in its high band. The gap between cities is real.
That is why the free first class matters: the mentor checks whether English-taught data science will be comfortable for you now, or whether you would gain more by starting with our shorter courses first.
Class times
Whenever you book them. Peru and India keep fixed clocks, so a weekly slot never moves.
| Peru time | India time | Suits |
|---|---|---|
| 05:30 | 16:00 | Early risers |
| 10:30 | 21:00 | Students free in the morning |
| 17:30 | 04:00, next day | After university |
| 21:00 | 07:30, next day | After a full working day |
America/Lima stays at UTC minus 5 and has had no summer time since 1994 (tz database); Asia/Kolkata stays at UTC plus 5:30. India is 10 hours 30 minutes ahead throughout the year.
You pick in your own time zone when you book, and the mentor sees the converted time. Huancayo, Lima and the rest of Peru share one time zone, so the same slot works wherever you are in the country.
Progress
Our own milestones. The mentor checks each with work you explain, not with a quiz.
| Milestone | You can | The mentor checks |
|---|---|---|
| 1. Read | Open an unknown file and describe its columns, units and gaps | A short data note before any analysis |
| 2. Count | Write correct counts and summaries in plain Python | Numbers that match a second method |
| 3. Doubt | Spot a result that is too clean or too sudden | A list of checks run before reporting |
| 4. Compare | State a difference with its uncertainty | A confidence interval or a test, explained |
| 5. Model | Fit a model and beat a simple baseline honestly | Results on data the model never saw |
| 6. Report | Write findings that survive a sceptical reader | A two-page report with sources and licence |
Milestone 3 is the Huancayo lesson. It is the one that separates analysts people trust from analysts people double-check.
If your result is surprising, the first suspect is the data, the second is your code, and only the third is the world.
Every milestone leaves a notebook or report in the learner's portfolio, with data sources credited.
Our certificate of completion is our own; it is not a Peruvian university degree.
More courses
Foundations and maths for adults, routes for teenagers, and practical options for professionals. All live and in English.
PE / DS / 01
Python from zero before any data library.
Open the syllabusPE / DS / 02
Six months, no programming needed.
Open the syllabusPE / DS / 03
Statistics, linear algebra and the maths of ML.
Open the syllabusPE / TEEN / 01
The way in before the teen data science course.
Open the syllabusPE / TEEN / 02
Machine learning ideas without code, 24 classes.
Open the syllabusPE / TEEN / 03
From school maths to working models.
Open the syllabusPE / PRO / 01
Excel, Sheets and Power BI, four months.
Open the syllabusPE / PRO / 02
Applied machine learning, visually, in 24 classes.
Open the syllabusPE / PRO / 03
Automate the reports you build by hand.
Open the syllabusHow it works
Any day, any time, flexible: choose a batch, or for a very personalised plan choose 1-on-1 at the hour that suits your family.
Morning
A Peru morning is the Indian evening, an easy hour to think about data.
Night
Late Peru evenings are Indian mornings, and our mentors take those classes too.
1-on-1
Your own pace, data and slot, with one mentor.
Open datasets with real gaps, never toy tables only.
The mentor questions; you type and explain.
Who knows your projects and your blind spots.
New terms defined, ideas repeated until clear.
Every chart names its data and licence.
Fifteen to twenty learners, or one to one.
Student work
A few appear here; the student labs hold more.
AI and ML
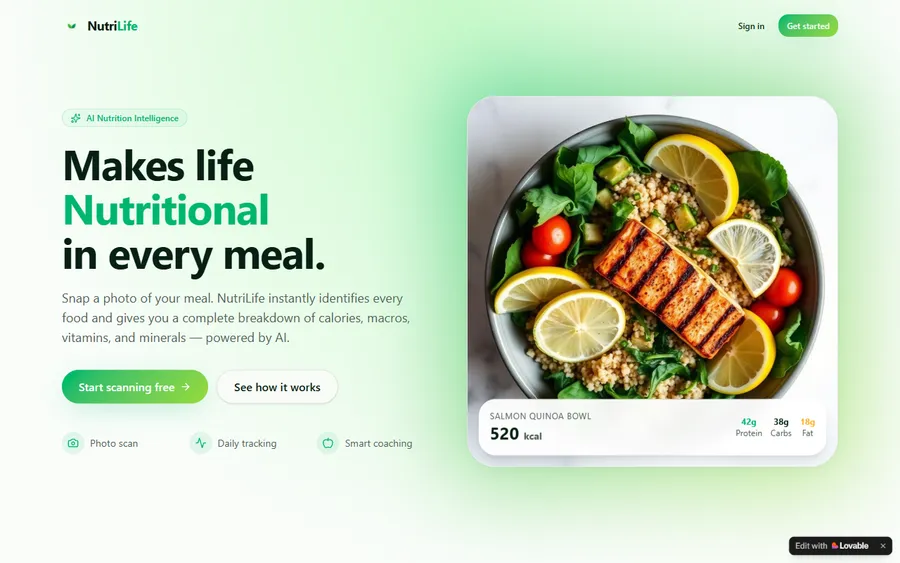
An AI nutrition coach that reads what you eat and works you toward a target.
AI and ML
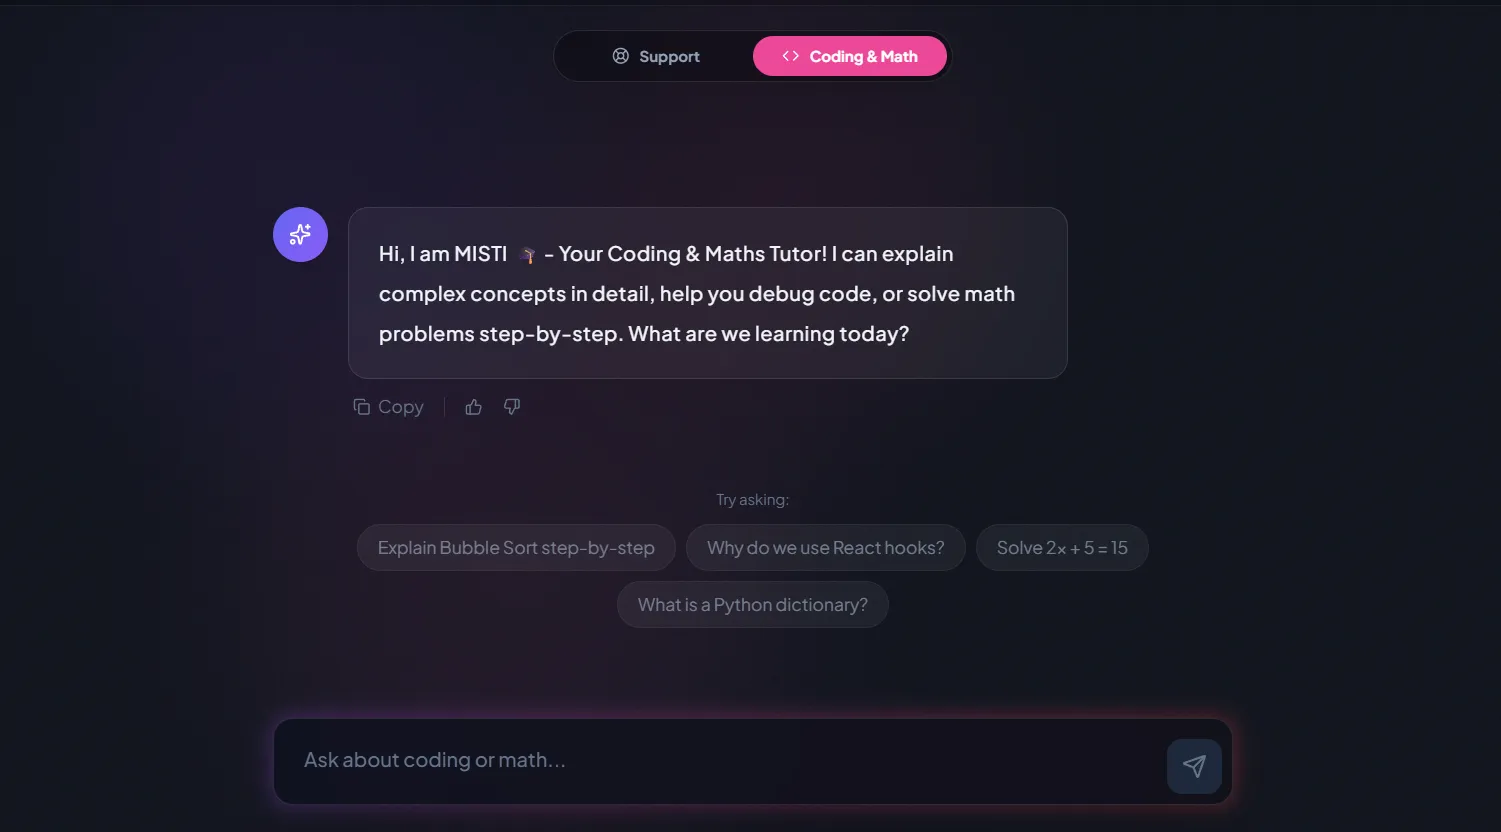
A chatbot that answers mathematics and programming questions, built and deployed by a student.
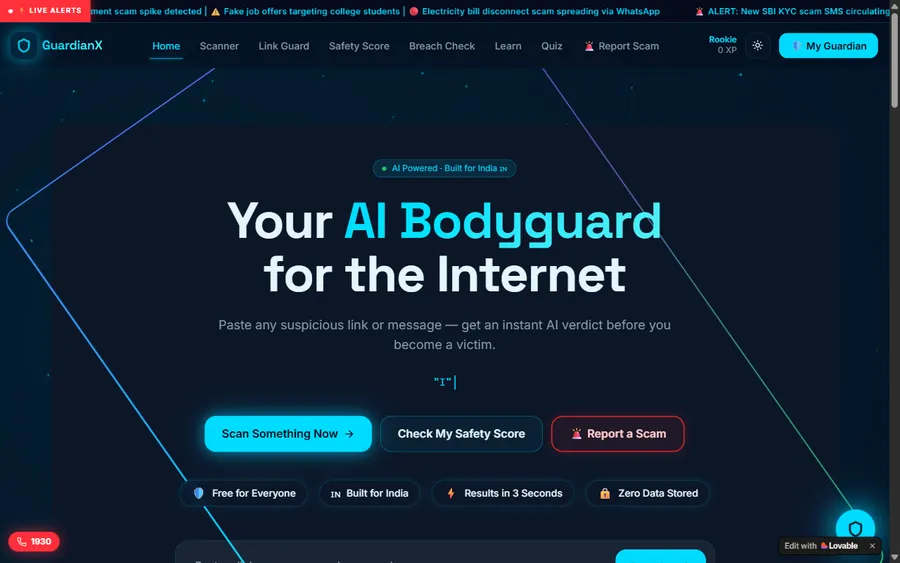
AI and ML
An assistant that helps a young person recognise unsafe situations online.
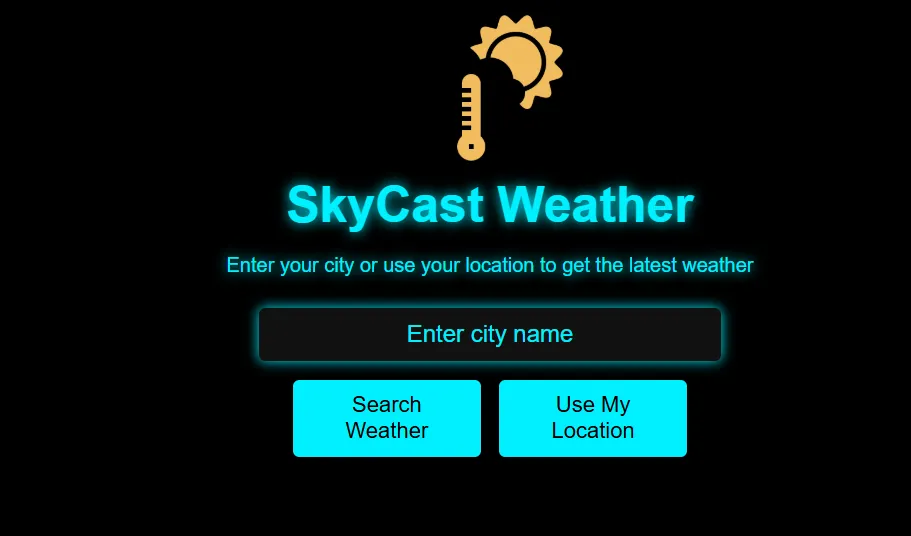
Web app
A weather forecasting site with live conditions for any location.
Fees
Pay one month at a time. The fee is in US dollars and your card is charged in dollars; the switch to soles happens at your bank, at the bank's rate, so the statement can differ slightly from the price.
Free first class
Free
no card required
Group batch
$100 USD
a month, eight live classes
One to one
$150 USD
a month, eight live classes
What families say
Google reviews by learners and parents, as they wrote them.
★★★★★
"The one step solution for my son. Modern Age Coders make learning coding so simple that kids love it. The teachers explain complex concepts clearly with practical exercises and interactive content."
Ria Mukherjee
Parent
★★★★★
"Modern Age Coders has been a game-changer for me. I struggled to grasp IT concepts and coding before joining, but their classes transformed everything. I can now confidently write complex programs with ease."
Samriddha Mondal
Student
★★★★★
"One of the most wonderful education centres out there. Education is not limited to school syllabus but focuses on skill development."
Vansh Agarwal
Student
★★★★★
"My child Dhairya is really enjoying the Modern Age Coders classes. This is his first online class and he eagerly looks forward to it. I can already see his improvement, and the teachers are very cooperative."
Sonam Oswal
Parent of Dhairya
★★★★★
"Modern Age Coders have wonderful teachers who teach in a clear, easy and practical way. The teacher boosts students' confidence and inspires them to learn without hesitation."
Sonu Goyal
Parent
★★★★★
"I highly recommend this computer coding class! The teachers are incredibly knowledgeable and passionate about coding."
Ritu Kedia
Parent
Questions from Peru
No. Our data science classes are given live, online and only in English. Mentors in India define each term, keep a calm pace and adapt to how you speak; pandas, scikit-learn and their documentation are English too.
Yes. The adult course starts with Python itself, assuming no programming. Some school maths helps; statistics is taught inside the course.
Yes, for ages 14 to 18 who already know basic Python, over six months. Teens who are new to code start with our Python course for teens first.
Yes, alongside international datasets. This page's lesson uses the Instituto Geofísico del Perú's hourly weather data from Huayao, published on datosabiertos.gob.pe under the ODC-By licence.
That you credit the source when you share work built on the data. We teach learners to name the publisher, the dataset and the licence under every chart.
School algebra, percentages and averages to begin. Statistics, probability and the linear algebra used in machine learning are taught as the course needs them.
Any day, any time, flexible: choose a batch, or for a very personalised plan choose 1-on-1 at the hour that suits your family. India runs 10 hours 30 minutes ahead of Peru, so a 21:00 class in Peru is 07:30 the next morning for the mentor.
Our full adult course runs 10 to 12 months from zero; the teen course is six months. Progress depends on practice between classes, and we promise no job.
The fee section shows the monthly price in US dollars, which is what your card pays; your bank turns it into soles. Visitors in India see rupees. The first class is free and asks for no card.
Yes, our own certificate of completion after the final exam. It is not a Peruvian university qualification; your analyses and reports are the stronger evidence.
No. We use the IGP's published open data under its licence and credit it; we have no connection with the IGP or any public body, and our conclusions are our own.
Read next
More for learners in Peru who work with data.
The Spanish page, with UNHEVAL enrolment data and a lesson on fake zeros.
Python from zero, explained in Spanish.
Numerical methods and lab data for engineering students.
Our full list of Peru pages.
The course overview for every country.
What a live class looks like.
Part of the guide: Every Peru page
More guides: Coding and AI classes in Peru · En español: clases de programación en inglés · Start here: English-medium coding in Lima · By age and stage: AI and coding for professionals · Exams, olympiads and school holidays: IB computer science tutor · Guides to choosing: An English-taught option to Crack The Code · Regions of Peru: Amazonas region · Cities: Arequipa: coding for every age · Lima and Callao districts: Programación para niños en Ancón
Start here
In the free class you open a real dataset with the mentor and talk about what you want to analyse. The mentor sees how you reason about numbers and how easily the English comes, then suggests a course.
Before booking, you can read how a class works or look at all course syllabuses.
WhatsApp us · +91 91233 66161 · connect@modernagecoders.com
Live online classes, taught only in English by mentors in India. WhatsApp, in English, is the quickest route to us.
A priority demo is a full class of about 45 to 60 minutes. After the class the mentor sends a written skill report and a personal learning roadmap on WhatsApp. If you enrol, the demo fee is adjusted against your first month's fee. Share your demo Order ID with us on WhatsApp and we take it off.
Book a priority demo