Orange Data Mining for College: Reproducible Machine Learning and Analytics
Cover a full data mining syllabus on a visual canvas, then defend it: rigorous validation, feature engineering, explainability, clustering, text and time series, and a capstone that reproduces from raw data on someone else's machine.
Syllabus updated August 2026
Recordings are free with a Google sign-in. These recordings show how we teach, not the exact syllabus of this course.
How long this course takes
This course runs 24 classes (12 weeks · 2 classes/week) at 4-6 hours/week recommended. The range allows for background and pace: a complete beginner uses the full span, and a student with prior knowledge finishes sooner. The syllabus below is planned to the shorter end, with margin kept for revision.
For personalised duration planning, call +91 91233 66161 and we'll map a schedule to your goals.
At a glance
- Who it is for
- Beginner to applied practitioner (college students and graduates), no prior machine learning required.
- Prerequisites
- None required. The entire course can be completed without writing code. Students who already know Python get more from Class 22, where the Python Script widget and the Orange to scikit-learn concept map are covered, but nothing earlier depends on it Comfort with school-level statistics, averages, percentages, basic probability and reading a graph. Every further concept, from cross validation to regularisation to silhouette scores, is taught in the course at the point it is needed
- Format
- Live, interactive classes with a real instructor, never pre-recorded videos. Live classes run about one hour.
- Language
- English or Hindi, depending on the batch.
- Duration
- 24 classes (12 weeks · 2 classes/week)
- Weekly commitment
- 4-6 hours/week recommended
- Class size
- Group batches of 5 to 10 students, mini batches of 3 to 4, or 1-on-1.
- Certificate
- Certificate from Modern Age Coders, awarded on passing the final assessment
- Watch first
- Free recordings of real classes for ages 13 and up, free with a Google sign-in. These recordings show how we teach, not the exact syllabus of this course.
- Live demo
- Optional. Enroll directly on this page, or book a free live demo if you would like to meet a mentor first.
How we teach
Deep understanding. Real projects. Expert guidance.
Learn coding, AI and maths through careful explanations, practical demonstrations, and hands-on problem-solving. Our instructors guide you from the foundations to advanced ideas, helping you understand what happens, why it happens, and how to build it yourself.
You will explore concepts step by step, write and improve code, investigate mistakes, ask questions, and apply your knowledge to meaningful projects. Lessons are designed around active participation, thoughtful feedback, and growing independence.
Expert-led live teaching, with practical participation built into every lesson.
- Students explain their thinking.
- Instructors demonstrate, then guide practice.
- Learners code, solve, or build during lessons.
- Questions and misconceptions get attention.
- Assignments receive useful feedback.
- Progress is checked before advancing.
Ready to Master Orange Data Mining Course for College Students: Machine Learning and Analytics?
Choose your plan and start your journey into the future of technology today.
Rated 4.9 across 547 Google reviews. Enroll directly, or take a free live demo first if you like. No card needed for the demo. Monthly billing, cancel anytime.
International Students (Outside India)
Billed monthly in US dollars, the same price in every country. Contact us with any questions.
Program Overview
Data mining appears in almost every computer science, IT, statistics, business analytics and bioinformatics programme, and it is routinely taught as a list of algorithm names to memorise before an exam. This course teaches it as a practice. Orange is free, open source machine learning and data visualisation software developed at the Bioinformatics Laboratory, Faculty of Computer and Information Science, University of Ljubljana, released under the GNU GPL version 3 or later. It was built for teaching machine learning and data mining to university students, and it is used in real research work. You assemble analysis by connecting widgets on a canvas, which removes the syntax overhead and puts the entire course budget into method: how to prepare data defensibly, how to select a model without fooling yourself, and how to explain what the model did.
Across 24 live classes you work through the six default widget sets, Data, Transform, Visualize, Model, Evaluate and Unsupervised, and then into the add-on ecosystem that makes Orange genuinely useful for project work: Text for corpus analysis, Time Series for temporal data, Explain for model interpretation, Associate for rule mining, Geo for spatial data, and Fairness for auditing. You will build classification and regression pipelines, use Preprocess inside the modelling loop so that scaling and imputation are fitted on training folds rather than leaked across them, compare learners under identical cross validation in Test and Score, tune with Parameter Fitter, read ROC, precision-recall and calibration properly, and use Explain Model and Permutation Importance to answer the question a viva always asks: why did it predict that?
The course is deliberately not a dead end at the canvas. Orange is written in Python and installable from PyPI as Orange3, and the Python Script widget exposes real Python inside a workflow with the incoming data available in your namespace. Two classes are spent on that bridge, so students moving on to pandas and scikit-learn carry the concepts across rather than starting again. Every class is taught live in a small batch by a working practitioner, the same mentorship-first method Modern Age Coders has used since 2020 to teach 10,000+ students across 25+ countries. You finish with 24 reproducible workflows, a capstone that runs end to end from a raw file, and an exported report you can put in front of an examiner, a recruiter or a project guide.
What Makes This Program Different
- Built for defensible work, not demos: reproducibility, leakage control and honest validation are graded requirements from Phase 1, not closing remarks.
- Covers a full university data mining syllabus, preprocessing, classification, regression, evaluation, clustering, dimensionality reduction, association rules, text and time series, with a running artefact for each.
- Explainability is a full class, not a mention: Explain Model, Explain Prediction, Permutation Importance and ICE, so you can answer why a prediction happened.
- The Python bridge is taught explicitly: Orange is a Python library, the Python Script widget runs real Python inside the canvas, and the same models exist in scikit-learn.
- Free and open source under the GNU GPL v3 or later, so nothing in your final year project depends on a licence you lose after graduation.
- Capstone standard is reproduction: your workflow must rerun from the raw file in a clean session, on a machine that is not yours.
Your Learning Journey
Career Progression
Detailed Course Curriculum
Explore the complete week-by-week breakdown of what you'll learn in this comprehensive program.
Topics Covered
- What Orange is: open source machine learning and data visualisation software from the Bioinformatics Laboratory, Faculty of Computer and Information Science, University of Ljubljana, first released in 1996 and under the GNU GPL version 3 or later
- Why a visual tool belongs in a serious course: it was built to teach machine learning and data mining to university students, and it runs the same algorithms you would call from code
- Installation paths: the standalone installer on Windows and macOS, and installing the Orange3 package from the Python Package Index into a Python environment
- The interface: widget toolbox, canvas, the six default widget sets Data, Transform, Visualize, Model, Evaluate and Unsupervised, and the status bar
- How data flows: output channels, input channels, and choosing which channel a connection uses when a widget offers several
- The mental model that prevents most beginner errors: a widget recomputes whenever anything upstream changes, so the canvas is a live pipeline, not a sequence of clicks
- Course standards announced up front: every deliverable is an .ows workflow that reruns from the raw data file with no manual editing anywhere
Projects You Build
- Install Orange, build a File to Data Table to Distributions canvas on a bundled dataset, then deliberately change the upstream file and document exactly which downstream widgets recomputed
Practice & Assignments
Open three example workflows from the official examples page and write one sentence on what each pipeline is doing.
Assessment
Your first canvas plus a short written explanation of the live-pipeline model in your own words.
Topics Covered
- The File widget across formats: .csv, .tsv, Excel and Orange's native .tab, including delimiter and encoding problems and how to diagnose them
- CSV File Import for awkward files: header rows, decimal separators, thousands separators and locale issues
- SQL Table: reading directly from a database rather than exporting an intermediate spreadsheet nobody can reproduce
- Datasets: the bundled and downloadable example datasets used throughout the course for controlled comparisons
- Variable types in Orange, numeric, categorical, text and datetime, and the downstream failures caused by each mistyped column
- Roles: feature, target and meta, and why identifiers, names and free text must be pushed to meta rather than fed to a learner
- Data Info and Column Statistics as a mandatory first look: instances, features, missing values, constant columns and near-duplicates
Projects You Build
- Load one awkward real-world .csv, correct every mistyped column with Edit Domain, assign roles deliberately, and write a data dictionary describing every variable, its type and its role
Practice & Assignments
Import the same file twice, once correctly and once with a wrong delimiter, and record what silently went wrong.
Assessment
Your data dictionary plus a Data Info screenshot with a written note on every quality problem you found.
Topics Covered
- The three kinds of missingness in plain language, and why the reason a value is missing changes what you are allowed to do about it
- The Impute widget in full: leave as is, average or most frequent, replace with a fixed value, remove instances, and model-based imputation
- The decision that gets challenged in every viva: dropping rows versus imputing, and how to state your choice with a defensible reason
- Select Rows for rule-based filtering, and why filters belong in the workflow rather than in a spreadsheet you edited by hand
- Outliers: detecting them, and the separate question of whether to remove, cap, flag or investigate them
- Duplicate detection with Unique, and the near-duplicate problem that silently inflates every cross validation score
- Documenting cleaning: annotating the canvas so a reader can see every judgement you made and disagree with it if they want
Projects You Build
- Build a fully annotated cleaning pipeline on a messy dataset, recording instance counts before and after each step, and write a cleaning log justifying every decision
Practice & Assignments
Compare model-based imputation against mean imputation on the same column and record how the distribution changed.
Assessment
Your cleaning log with before and after counts, plus a defence of your imputation strategy.
Topics Covered
- Merge Data: inner, outer and left join behaviour on a shared key, and diagnosing the rows that silently disappear
- Concatenate for stacking sources, including what happens when the schemas do not quite agree
- Group by and Aggregate Columns: producing entity-level datasets from transaction-level records, the single most common real analytics task
- Pivot Table for cross-tabulation, and Transpose for datasets stored the wrong way round
- Formula: deriving ratios, differences, flags and interaction terms as genuine engineered features
- Select by Data Index and Data Sampler: reproducible sampling, stratified sampling, and holding out a set you genuinely do not look at
- Granularity discipline: knowing exactly what one row represents at every point in your pipeline
Projects You Build
- Build an entity-level analysis dataset from at least two source tables using Merge Data and Group by, engineer three derived features with Formula, and document what one row represents at each stage
Practice & Assignments
Perform the same join two ways and reconcile the row counts, explaining any difference.
Assessment
Your multi-table workflow plus the row-meaning documentation at each stage.
Topics Covered
- The Preprocess widget as a single reusable block: normalisation, standardisation, imputation, feature selection, discretisation, continuisation and randomisation
- The leakage rule stated early and repeated all course: preprocessing that learns from data, such as scaling or imputation, must be fitted inside the validation loop, not applied to the whole dataset first
- How Orange helps: connecting Preprocess into a learner so the preprocessing is fitted per training fold during cross validation
- Purge Domain and Randomize: cleaning unused categories, and shuffling a target deliberately as a sanity check that your pipeline cannot score well on noise
- Saving workflows as .ows files: XML describing widgets, their settings and their connections, saving the workflow and settings but not the data
- Consequences for sharing: an .ows file needs its data file alongside it, so a shareable project is a folder, not a single file
- Workflow engineering standards: left to right layout, renamed widgets, canvas notes, and a README describing how to rerun the analysis
Projects You Build
- Package everything from Classes 2 to 4 as a reproducible project folder: annotated .ows workflow, raw data file and a README, then have a classmate rerun it from scratch and report any step they could not reproduce
Practice & Assignments
Run the shuffled-target sanity check on your pipeline and confirm performance collapses to baseline as it should.
Assessment
A project folder a classmate successfully reran, plus their written reproduction report.
Topics Covered
- Distributions: shape, skew, modality and the long tail, and what each implies for the models available to you
- Box Plot and Violin Plot: comparing groups on a numeric variable, including unequal group sizes and what that does to a visual comparison
- Central tendency and dispersion together: why reporting a mean without a spread is an incomplete claim
- Detecting distributional problems that break specific models, such as heavy skew for distance-based methods
- Transformations in plain terms, and when a log-style transformation genuinely helps versus when it just hides the problem
- Target distribution first: class imbalance diagnosed before any model is trained, using Distributions on the target
- Stating an exploratory finding as a hypothesis to test rather than a conclusion to announce
Projects You Build
- Produce a full univariate profile of your dataset, every numeric variable charted and described, every categorical variable tabulated, ending with three written hypotheses worth testing
Practice & Assignments
Identify one variable whose mean misrepresents it and justify a better summary statistic.
Assessment
Your univariate profile document plus the three hypotheses with the evidence that prompted each.
Topics Covered
- Scatter Plot with class colouring, point size and shape used as genuine extra dimensions
- Find Informative Projections: ranking variable pairs by how well they separate the target classes
- Rank: scoring features by information gain, gain ratio, gini, chi square, ReliefF and FCBF, and reading the disagreements between scores as information
- Sieve Diagram and Mosaic Display for categorical against categorical relationships
- Linear Projection, Radviz and FreeViz for looking at many variables at once in a single plane
- Selecting subsets directly from a plot and sending them downstream for inspection, the fastest way to interrogate a suspicion
- The discipline of the alternative explanation: for every relationship you find, write the confounder that could produce it
Projects You Build
- Rank every feature by at least three scoring methods, reconcile the disagreements in writing, and build the informative projection that best separates your target classes
Practice & Assignments
Take your strongest bivariate relationship and write two plausible confounders for it.
Assessment
Your multi-method feature ranking with a written reconciliation, plus the projection and its interpretation.
Topics Covered
- Correlations: ranking every numeric pair, and reading the coefficient without over-claiming what it establishes
- Multicollinearity: what happens to a linear model's coefficients when two features carry the same information, and why the model can still predict well while its explanation becomes worthless
- Heat Map with row and column clustering for whole-dataset structure at a glance
- Distances: Euclidean, Manhattan, cosine, Jaccard and others, and choosing a measure that matches the data type and the question
- Distance Map, Distance Matrix and Distance Transformation as the shared foundation under clustering and nearest neighbour methods
- Why normalisation must precede distance, demonstrated by breaking it deliberately with one large-scale feature
- Feature selection versus dimensionality reduction: dropping features versus combining them, and when each is appropriate
Projects You Build
- Diagnose multicollinearity in a numeric dataset, decide which features to drop with a written justification, and demonstrate the effect on a linear model's coefficients before and after
Practice & Assignments
Compute the same distance matrix under three distance measures and describe how the neighbourhood structure changed.
Assessment
Your multicollinearity report including the coefficient comparison and your retained feature set.
Topics Covered
- Feature engineering as the highest-leverage work in applied machine learning, with worked examples of features that transformed a weak model
- Formula: ratios, differences, flags, counts and interaction terms built inside the workflow, and Create Instance for testing a model on a hand-specified case
- Discretize: equal width, equal frequency and entropy-based binning, and what each does to the information in a variable
- Continuize: one-hot and ordinal treatment of categorical variables, and matching the encoding to the model that will consume it
- Create Class: deriving a target variable from raw columns, and the leakage danger that this step invites
- Domain knowledge as a feature source: interviewing the person who understands the data before engineering anything
- Testing whether a feature earned its place: rerun the cross validated comparison with and without it
Projects You Build
- Engineer at least five new features from domain reasoning, then run a cross validated with-and-without comparison for each and keep only the ones that measurably earned their place
Practice & Assignments
Compare equal-frequency and entropy-based discretisation of the same variable and note the difference in downstream model performance.
Assessment
Your feature engineering log showing each candidate feature, its rationale, its measured effect and your keep or drop decision.
Topics Covered
- The Report system: most widgets carry a report button in the status bar that appends the current view to a running report
- Which widgets do not report, and why the ones that only transmit or display data are excluded
- Structuring an analytical report the way a reader needs it: question, data and its limits, method, evidence, result, threats to validity
- Adding written commentary to report sections so the argument, not just the output, is preserved
- Exporting as .html or .pdf for submission, and as .report so a reader can reopen the exact workflow behind each section
- Reopening reports through File then Open Report, and the report view via Shift and R
- Presenting to a non-technical audience: what to cut, what to keep, and how to state uncertainty without losing the room
Projects You Build
- Produce a complete exploratory data analysis report on your project dataset: question, data dictionary, univariate and bivariate evidence, engineered features, and a stated set of limitations, exported as PDF
Practice & Assignments
Cut your report to a three minute verbal summary and note what you were forced to drop.
Assessment
Your exported EDA report, graded on whether every claim in it is supported by a visible piece of evidence.
Topics Covered
- Supervised learning framed properly: a hypothesis space, a loss, and an estimate of generalisation error, all in plain language
- Classification versus regression, decided by the target variable, and the metrics that come with each
- The Orange modelling shape: data into learner into Test and Score, with Preprocess attached to the learner rather than the data
- Constant as the mandatory baseline, and Feature as Predictor as a second reference point using a single variable
- Choosing a validation design: train and test split, k-fold cross validation, stratified folds, leave one out, and repeated sampling, with the cost and reliability of each
- Class imbalance: what accuracy hides, and why AUC, F1, precision and recall exist
- Declaring your evaluation protocol before you look at any result, and writing it into the project README
Projects You Build
- Write and register your evaluation protocol for the course project, then establish both baselines with stratified 10-fold cross validation and record the numbers every later model must beat
Practice & Assignments
Run the same model under three validation designs and record how much the estimate moves.
Assessment
Your registered evaluation protocol plus a baseline results table with the validation design justified.
Topics Covered
- Decision tree induction: impurity measures, the greedy split search, and stopping criteria as the practical control on complexity
- The Tree widget's parameters, minimum instances in a leaf, maximum depth, and splitting thresholds, mapped to bias and variance
- Tree Viewer, Pythagorean Tree and Pythagorean Forest for reading structure rather than guessing at it
- CN2 Rule Induction and CN2 Rule Viewer: learning an ordered or unordered rule set you can read as if-then statements
- Scoring Sheet and Scoring Sheet Viewer: producing the kind of simple point-based model that regulated domains actually accept
- Overfitting demonstrated live: growing a tree until training accuracy is perfect and cross validated accuracy collapses
- The interpretability and accuracy trade-off, and the domains where an interpretable model is a requirement rather than a preference
Projects You Build
- Train a tuned decision tree and a CN2 rule set on the same problem, extract the decision logic from both as written rules, and compare their cross validated performance against your baselines
Practice & Assignments
Sweep maximum depth across five values and tabulate training against cross validated accuracy to locate the overfitting point.
Assessment
Your extracted rule set in plain English plus the overfitting curve with the depth you chose and why.
Topics Covered
- k Nearest Neighbours: the choice of k, distance measure and weighting, and its total dependence on feature scaling
- Naive Bayes: the conditional independence assumption, why it is usually false, and why the model often works anyway
- Linear Regression in Orange: predicting a continuous target, with ridge and lasso regularisation and what each penalty does
- Regression metrics and how to read them: MSE, RMSE, MAE and R squared, and what R squared does not tell you
- PLS and Curve Fit for the cases where ordinary linear regression is the wrong shape
- Stochastic Gradient Descent as a learner, and the intuition of iterative optimisation without the calculus
- Choosing a model family from the data and the requirement, not from familiarity
Projects You Build
- Build a full regression pipeline on a continuous target, compare linear regression with and without regularisation against kNN regression, and report RMSE and R squared under identical cross validation
Practice & Assignments
Run kNN with and without normalisation inside the Preprocess block and quantify the difference.
Assessment
Your regression comparison table with metrics defined in your own words and a justified model choice.
Topics Covered
- Test and Score read properly: comparing learners under identical folds, and the meaning of the variation between folds
- Confusion Matrix: the four cells expressed as real costs in the actual application domain
- Precision, recall, specificity and F1 derived from that matrix rather than memorised
- ROC Analysis: the curve as every threshold at once, AUC interpreted as a ranking probability, and reading multiple models on one plot
- Performance Curve for the operational question of how many cases you must action to capture a given share of positives
- Calibration Plot: whether predicted probabilities behave like probabilities, and Calibrated Learner as the fix
- Choosing the operating threshold from the cost of each error type rather than accepting 0.5 by default
Projects You Build
- Evaluate every model built so far on one problem with a full evaluation dossier: metrics table, confusion matrices with stated costs, ROC comparison, calibration plot, and a recommended operating threshold with its justification
Practice & Assignments
Take a poorly calibrated model, apply Calibrated Learner, and document the change in the calibration plot.
Assessment
Your evaluation dossier, graded on whether the threshold recommendation follows from stated error costs.
Topics Covered
- Random Forest: bagging plus random feature subsets, why decorrelated trees generalise better, and the parameters that matter
- Gradient Boosting: sequential correction of residuals, and the learning rate and depth interaction that governs overfitting
- AdaBoost: reweighting the examples the ensemble keeps getting wrong
- Support Vector Machines: margins, the kernel trick explained without the algebra, and the cost parameter
- Neural Network in Orange: hidden layer sizes, activation functions, the solver, and realistic expectations on tabular data of student scale
- Stacking: combining several learners with a meta-learner, and the extra validation care it demands
- The honest finding that a well tuned simple model frequently matches an ensemble, and why reporting that is good work
Projects You Build
- Run a full learner tournament, baseline through neural network and stacking, under one fixed cross validation, and write a model selection memo that justifies your winner on grounds beyond the top accuracy figure
Practice & Assignments
Vary the gradient boosting learning rate and depth together and record where performance stops improving.
Assessment
Your model selection memo, which must address performance, variance across folds, interpretability and runtime.
Topics Covered
- Parameter Fitter: searching a learner's parameters systematically instead of by intuition
- The tuning trap named precisely: selecting parameters using the same data you then report performance on inflates your result
- Nested validation in principle, and the practical discipline of a genuinely held-out set that is opened exactly once
- Permutation Plot and the shuffled-target sanity check as evidence that your pipeline is not learning noise
- Predictions: scoring new unlabelled data, reading class probabilities, and exporting results with Save Data
- Save Model and Load Model: persisting a fitted model so scoring does not require retraining
- The leakage catalogue, target leakage, temporal leakage, group leakage and preprocessing leakage, each with the symptom that gives it away
Projects You Build
- Tune your chosen model with Parameter Fitter, evaluate the tuned model on a held-out set you have not previously touched, run the shuffled-target check, and write a leakage audit against all four leakage types
Practice & Assignments
Deliberately introduce a leaking feature, observe the implausible score, and document how you would have caught it.
Assessment
Your held-out result with the tuning protocol described, plus your completed four-point leakage audit.
Topics Covered
- Unsupervised learning framed honestly: no ground truth, so validity has to be argued rather than measured against an answer key
- k Means: the algorithm step by step, initialisation sensitivity, and scoring a range of k automatically
- Silhouette score and Silhouette Plot: evaluating cohesion and separation, and finding the points that were forced into the wrong cluster
- Hierarchical Clustering: linkage methods, reading a dendrogram, and choosing the cut height defensibly
- DBSCAN: density-based clusters of arbitrary shape, the epsilon and minimum points parameters, and the ability to label points as noise
- Louvain Clustering and Self-Organizing Map as further approaches, and Interactive k-Means from the Educational add-on for stepping through the algorithm
- Profiling clusters into an interpretation: describing each group by its distinguishing features so the result means something to a domain reader
Projects You Build
- Cluster one dataset with k means, hierarchical clustering and DBSCAN, justify your chosen k or cut with silhouette evidence, and write a business-readable profile of every cluster you keep
Practice & Assignments
Run k means on uniformly random data and write the paragraph explaining why its clusters are meaningless.
Assessment
Your three-method comparison with silhouette evidence, plus interpretable profiles for each final cluster.
Topics Covered
- PCA: principal components as ordered directions of maximum variance, and using explained variance to choose how many to keep
- The interpretability cost of PCA, and when a loading is still readable enough to explain
- t-SNE, MDS and Manifold Learning for visualisation, with an explicit warning about over-reading distances between separated clusters in a t-SNE plot
- Correspondence Analysis for categorical structure
- Outliers: detection methods and the analyst's decision about whether an outlier is an error, a rare event, or the entire point of the study
- The Associate add-on: frequent itemsets and association rules, with support, confidence and lift defined precisely
- Reading association rules critically: high confidence with low lift is usually just a popular item, not a relationship
Projects You Build
- Reduce a wide dataset with PCA, visualise it with t-SNE, then mine association rules on a transactional dataset and identify three rules that are genuinely informative by lift rather than merely frequent
Practice & Assignments
Cluster on raw features and on PCA components and compare silhouette scores and cluster interpretability.
Assessment
Your dimensionality reduction analysis plus three association rules with support, confidence and lift interpreted correctly.
Topics Covered
- Why explainability is now a requirement: examiners, regulators, clinicians and clients all ask why, and a score is not an answer
- The Explain add-on: Explain Model for global feature attribution across the dataset
- Explain Prediction and Explain Predictions: why this specific instance received this specific output
- Permutation Importance: measuring a feature's contribution by breaking it and observing the damage
- ICE plots for seeing how a prediction responds as one feature is varied across its range
- Nomogram for logistic regression as a fully transparent alternative to post-hoc explanation
- The Fairness add-on: auditing model behaviour across a sensitive attribute, and the fact that a fairness problem is usually a data problem
Projects You Build
- Take your best model, produce a global explanation and three individual prediction explanations, run a permutation importance check, and audit the model across one sensitive attribute with a written finding
Practice & Assignments
Find one instance your model got confidently wrong and explain, from its attribution, why it failed.
Assessment
Your explainability report including global attribution, three instance-level explanations, and the fairness audit finding.
Topics Covered
- Installing add-ons through Options then Add-ons, and what the Text add-on contributes to the toolbox
- Corpus, Import Documents and Create Corpus: loading documents as data, including a folder of your own files
- Preprocess Text in detail: transformation, tokenisation, normalisation with stemming or lemmatisation, stop word and lexicon filtering, and n-grams
- Bag of Words with term frequency and TF-IDF weighting, and what a bag of words representation discards
- Document Embedding as the modern alternative, and when it beats a bag of words
- Analysis widgets: Word Cloud, Concordance, Statistics, Word Enrichment, Extract Keywords and Duplicate Detection
- Topic Modelling and Corpus Viewer, plus Sentiment Analysis with an honest account of its failure modes on sarcasm, negation and mixed-language text
Projects You Build
- Build an end to end text pipeline: load a corpus, preprocess it deliberately, represent it with both bag of words and embeddings, classify or topic-model it, and evaluate the two representations against each other under identical validation
Practice & Assignments
Rerun your pipeline with stemming, with lemmatisation and with neither, and tabulate the effect on your metric.
Assessment
Your text mining report comparing both representations, with named topics or a validated classifier and its limitations.
Topics Covered
- The Time Series add-on: As Timeseries for converting a table, Line Chart, and Yahoo Finance for pulling market data
- Why time series breaks the rules you learned: rows are not independent, so ordinary shuffled cross validation leaks the future into the past
- Interpolate, Moving Transform and Seasonal Adjustment: filling gaps, computing rolling statistics, and separating trend, seasonality and remainder
- Correlogram and Periodogram: autocorrelation and periodicity, and finding the cycle length in real data
- ARIMA Model and VAR Model: univariate and multivariate forecasting, with Model Evaluation for out-of-sample assessment
- Granger Causality read carefully: predictive precedence is not causation, whatever the widget is called
- The Geo add-on and the Network add-on named and demonstrated for spatial and relational project data
Projects You Build
- Take a real time series, decompose it, identify its dominant period, fit an ARIMA model, evaluate it out of sample against a naive last-value baseline, and state honestly whether the model beat the baseline
Practice & Assignments
Demonstrate the leakage caused by shuffled cross validation on time series data and quantify how much it inflates the score.
Assessment
Your forecasting workflow with an out-of-sample evaluation and an explicit comparison against the naive baseline.
Topics Covered
- Orange3 as a Python package installable from the Python Package Index, with a current Python version required for the pip installation route
- The Python Script widget: running real Python inside the canvas when no existing widget does what you need
- The widget's namespace: in_data, in_distance, in_learner, in_classifier and in_object arrive from the input signals, and are None when nothing is connected
- Returning results to the canvas so a script sits in the middle of a workflow rather than at the end of it
- The Orange.data.Table object and how it maps onto the pandas DataFrame most students will meet next
- The concept map from Orange to scikit-learn: learner to estimator, Test and Score to cross_val_score, Preprocess to Pipeline, Parameter Fitter to GridSearchCV
- Choosing the right tool honestly: canvas for exploration, comparison and communication, code for automation, scale and version control
Projects You Build
- Insert a Python Script widget into an existing workflow to compute something no widget provides, pass the result downstream, and write the equivalent scikit-learn outline for one pipeline you built earlier in the course
Practice & Assignments
Map five widgets you used this course onto their scikit-learn equivalents in a written table.
Assessment
Your working Python Script integration plus the Orange to scikit-learn concept map.
Topics Covered
- Scoping a capstone that is answerable: a specific question, an obtainable dataset, a defined target and a stated success criterion
- Sourcing data responsibly: open government portals, research repositories, Kaggle and institutional data, with the licence and any consent conditions checked and recorded
- Applying the full pipeline discipline: data dictionary, cleaning log, engineered feature log, registered evaluation protocol, held-out set
- Beating the baseline, and the professional willingness to report that the sophisticated approach did not win
- Threats to validity written before the conclusion: sample bias, leakage, confounding, temporal drift and generalisation limits
- Mentor review checkpoint: an instructor interrogates your canvas the way an examiner will, step by step
- Assembling the deliverable folder: .ows workflow, raw data, README with rerun instructions, and the report
Projects You Build
- Build your complete capstone from raw data to evaluated model and written conclusion, defended live in a mentor review that challenges every methodological choice
Practice & Assignments
Have a classmate rerun your capstone folder on their own machine and log every step that failed.
Assessment
A capstone that reproduces from raw data in a clean session on someone else's machine, plus your threats-to-validity section.
Topics Covered
- Assembling the final report: question, data and provenance, method, evidence, results with uncertainty, threats to validity, and conclusion
- Exporting for the audience you have: PDF for submission, and .report so a reviewer can reopen the workflow behind every figure
- Presenting under questioning: leading with the question and the answer, defending the method, and saying clearly when something is unknown
- The interview and viva questions this course prepares you for: why that validation design, why that metric, how did you rule out leakage, why should the model be believed
- Portfolio assembly: 24 reproducible workflows plus the capstone, organised so a reviewer can open any one and follow it
- Continuing paths: Python with pandas and scikit-learn, statistics and experimental design, and further Orange add-ons including Bioinformatics, Single-Cell, Spectroscopy, Survival Analysis and Network
- Staying current with the tool: the official Orange documentation, workflow examples and video lessons, and the open source repository itself
Projects You Build
- Present your capstone under live questioning, submit the exported report and complete portfolio, and receive written feedback plus your certificate assessment
Practice & Assignments
Write the one page project proposal for your next analysis, including its question, data source, evaluation protocol and baseline.
Assessment
Your defended presentation, exported report and 24-workflow portfolio, assessed on methodological rigour as much as on results.
Projects You'll Build
Build a professional portfolio with 24 reproducible workflows, one per class, plus a capstone project that reruns from raw data on another person's machine real-world projects.
Weekly Learning Structure
Certification & Recognition
Technologies & Skills You'll Master
Comprehensive coverage of the entire modern web development stack.
Support & Resources
Career Outcomes & Opportunities
Transform your career with industry-ready skills and job placement support.
Prerequisites
Who Is This Course For?
Career Paths After Completion
Salary & Market Context
The ranges below are general market salary bands for these roles in India and abroad, drawn from public industry data. They are shown for career context only and are not a promise or guarantee of income. Actual pay depends on your skills, experience, location, and the job market.
Course Guarantees
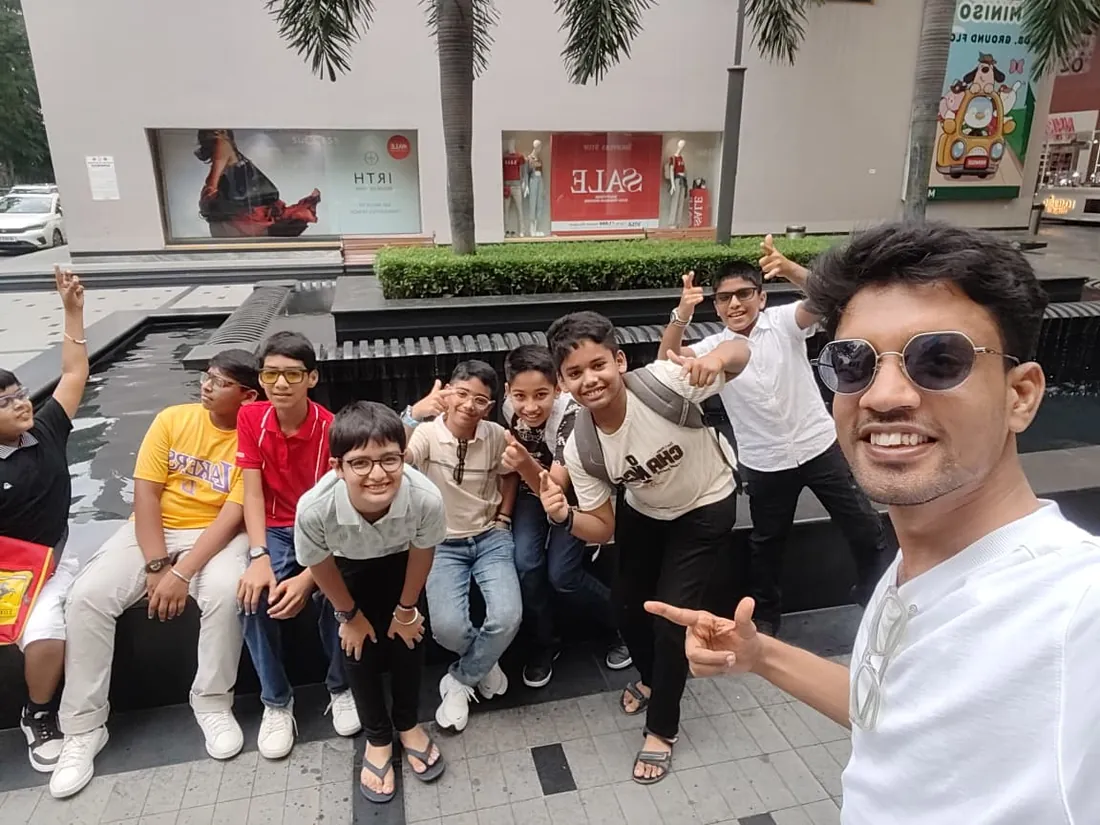
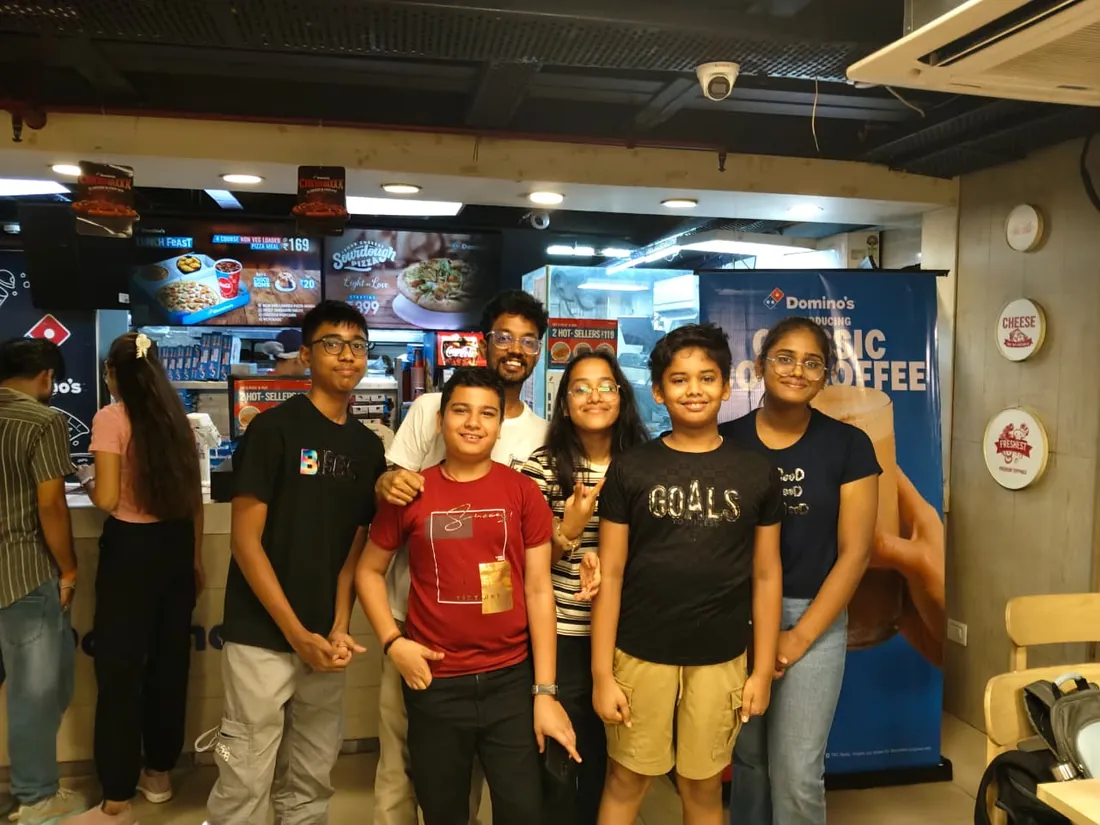
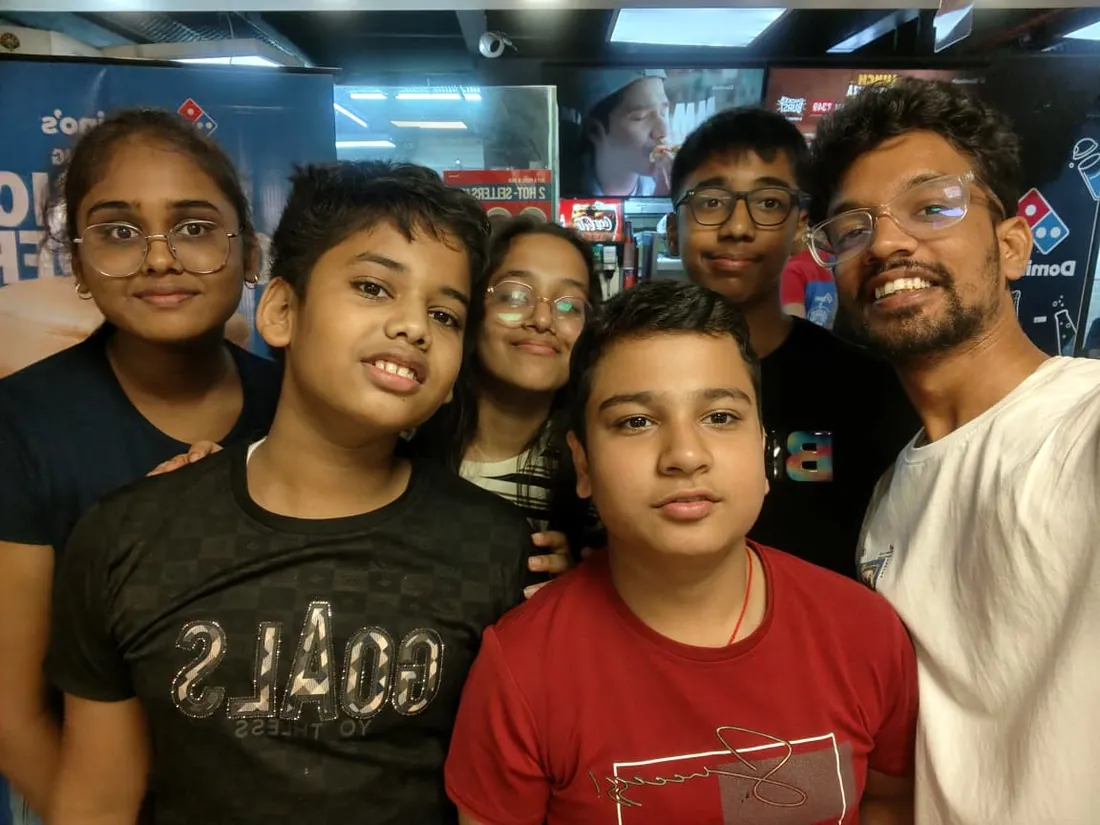
Real students. Real moments. Real joy.
These are our actual student meetups. No stock photos, no filters. Swipe through and meet the community you'll be joining.
































What families say
Straight from the parents and students who learn with us. Rated 4.9 across 547 Google reviews.
“Mivaan enjoys the class. He understands the concepts and completes his tasks with excitement. He started taking interest in coding… truly amazing class.”
“I absolutely love it here! I made new friends and learned important valuable coding skills while having the fun of my life. It's not just coding here, it's outings, bonding and most importantly preparing you for your future. Definitely five stars.”
“What stands out most is how excited my son is before every class. He looks forward to learning, problem-solving, and sharing what he's built. I've noticed a big boost in his confidence!”
“Modern Age Coders has been a game-changer for me! I struggled to grasp IT concepts and coding before joining, but their classes transformed everything. I'm now the topper in my class and can confidently write complex programs with ease.”
“Modern Age Coder have wonderful teachers who teach in a clear, easy and practical way. The teacher boosts students' confidence, keeps them updated with technology, and inspires them to learn without hesitation.”
“The one step solution for my son. Modern Age Coders make learning coding so simple that kids love it.”
“Coding classes here make learning very interesting and conceptual. The teachers teach us in a very easy-to-understand and efficient manner.”
“One of the most wonderful education centres out there. Education is not limited to school syllabus but focuses on skill development. Learning here has been a wonderful journey and still continuing.”
“I highly recommend this computer coding class! The teachers are incredibly knowledgeable and passionate about coding. They make every session engaging and insightful.”
“My child Dhairya is really enjoying the Modern Age Coder IT classes. This is his first online class, and he eagerly looks forward to it.”
“Very good classes. Don't worry about coding. They teach the best, especially Shivam sir.”
“Very good classes. Makes learning very easy and interactive.”
Hear it from our students
Real parents and students in their own words, on our public YouTube channel.
Straight answers about Orange Data Mining Course for College Students: Machine Learning and Analytics
- Who should take this course?
- Beginner to applied practitioner (college students and graduates), no prior machine learning required. It suits undergraduates with a data mining, machine learning or data warehousing paper who want to actually practise the syllabus rather than memorise algorithm names for an exam; students building a project, dissertation or research paper who need a defensible methodology and a workflow that reproduces under scrutiny; students in statistics, economics, commerce, psychology, biology, biotechnology and public health who have real data and a real question but no interest in a six week detour through python syntax.
- What will they learn and build?
- Data mining appears in almost every computer science, IT, statistics, business analytics and bioinformatics programme, and it is routinely taught as a list of algorithm names to memorise before an exam. This course teaches it as a practice.
- How deeply are topics covered?
- The course runs 24 classes (12 weeks · 2 classes/week) at 4-6 hours/week recommended, across 5 phases listed week by week in the syllabus below. A structured, well-paced curriculum taught step by step, with hands-on practice in every session.
- Who teaches it?
- Modern Age Coders mentors, who teach the live classes themselves. You can watch them at work in the free class recordings before you decide.
- How do practice, feedback and assessment work?
- Classwork every session, a task after every class, monthly reviews that mix in earlier topics, and a final project defended live, plus a written assessment that decides the certificate: real knowledge and real work, with a free retest after revision if needed. Doubt support between classes over WhatsApp, so you are never left stuck. A certificate you earn by passing the final assessment, with a free retest after revision if needed.
- What does it cost?
- Three monthly plans: a group batch, a mini batch and 1-on-1. Prices are shown in your currency in the plans section. Monthly billing, cancel any time.
- When can classes take place?
- Live classes are scheduled around your week. Group batches meet at a fixed weekly slot; 1-on-1 students choose their own. International students are scheduled in their own timezone. Ask on WhatsApp for the current slots.
- Can I watch the teaching before deciding?
- Yes. Full recordings of real 13 and up classes are free to watch, free with a Google sign-in. These recordings show how we teach, not the exact syllabus of this course. Some classes are in English and some in Hindi; everyone follows at their own pace. Watch a class end to end, like you are in it. Sessions are interactive and each moment builds on the last.
- Can I enroll without a live demo?
- Yes. Choose a plan on this page and enroll directly; a booking or a demo is not required. A free live demo is optional, for anyone who wants to meet a mentor first. Outside India, our team confirms the plan and completes payment with you over WhatsApp, so allow a little time for that step.
Common Questions About Orange Data Mining Course for College Students: Machine Learning and Analytics
Get answers to the most common questions about this comprehensive program
Still have questions? We're here to help!
Contact UsWhy Choose Orange Data Mining Course for College Students: Machine Learning and Analytics?
Related Courses You May Like
Continue your learning journey with these recommended programs
 Data Science & Machine Learning
Orange Data Mining Course for Teens: Machine Learning Without Code
Learn Orange Data Mining in 24 live classes for teens 13-18: build machine learning workflows by con...
Explore Course Web Development
Frontend Development for Teens: CSS Craft to React UI
Frontend course for teens aged 13-18 with a design soul: CSS mastery, Tailwind, animations, JavaScri...
Explore CourseRelated Articles & Guides
Deepen your knowledge with these hand-picked articles
 Technology
26 min read
Technology
26 min read
Best Data Science Courses in India for Students and Professionals in 2026
Comprehensive guide to the best data science courses in India for 2026. Compare IITs, IIMs, online p...
Read Article Career
28 min read
Career
28 min read
Data Science, AI, and Math: Skills Every Tech Professional Must Learn
Master data science, AI, and math skills for 2025. Complete guide with skill assessments, learning p...
Read ArticleReady to start Orange Data Mining Course for College Students: Machine Learning and Analytics?
Book a free demo class to meet your mentor and see how we teach, with no commitment. Or enrol now and start this week.