Statistics & Probability
The subject that decides whether a claim is evidence or noise, taught on real data from the first week.
Syllabus updated August 2026
Questions? WhatsApp +91 91233 66161 or email connect@modernagecoders.com
Recordings are free with a Google sign-in. These recordings show how we teach, not the exact syllabus of this course.
Our promise
The world's best learning experience, open to everyone.
- World-class instructorsEvery class is taught by an instructor who specialises in that exact field.
- No compromise on qualityEvery lesson, project and piece of feedback is held to the highest standard.
- Education for everyoneLearners aged 6 to 67, from first-time beginners to working professionals, in 25+ countries.
If you want the highest quality, Modern Age Coders is the right choice.
Book a Priority DemoHow long this course takes
This course runs 6 months (24 weeks) at 2 live classes/week + 3-4 hours practice. The range allows for background and pace: a complete beginner uses the full span, and a student with prior knowledge finishes sooner. The syllabus below is planned to the shorter end, with margin kept for revision.
For personalised duration planning, call +91 91233 66161 and we'll map a schedule to your goals.
At a glance
- Who it is for
- College students and working professionals; no programming required.
- Prerequisites
- Comfortable school algebra: rearranging formulas and working with fractions and percentages. No calculus is needed anywhere in the course
- Format
- Live, interactive classes with a real instructor, never pre-recorded videos. Live classes run about one hour.
- Language
- English or Hindi, depending on the batch.
- Duration
- 6 months (24 weeks)
- Weekly commitment
- 2 live classes/week + 3-4 hours practice
- Class size
- Group batches of 5 to 10 students, mini batches of 3 to 4, or 1-on-1.
- Certificate
- Certificate from Modern Age Coders, awarded on passing the final assessment
- Watch first
- Free recordings of real classes for ages 13 and up, free with a Google sign-in. These recordings show how we teach, not the exact syllabus of this course.
- Live demo
- Optional. Enrol directly on this page, or book a Priority Demo: a full live class of about 45 to 60 minutes with a mentor reserved for you.
- Questions
- WhatsApp +91 91233 66161 or email connect@modernagecoders.com.
How we teach
Deep understanding. Real projects. Expert guidance.
Learn coding, AI and maths through careful explanations, practical demonstrations, and hands-on problem-solving. Our instructors guide you from the foundations to advanced ideas, helping you understand what happens, why it happens, and how to build it yourself.
You will explore concepts step by step, write and improve code, investigate mistakes, ask questions, and apply your knowledge to meaningful projects. Lessons are designed around active participation, thoughtful feedback, and growing independence.
Expert-led live teaching, with practical participation built into every lesson.
- Students explain their thinking.
- Instructors demonstrate, then guide practice.
- Learners code, solve, or build during lessons.
- Questions and misconceptions get attention.
- Assignments receive useful feedback.
- Progress is checked before advancing.
How to join Statistics & Probability: Data to Hypothesis Testing
Four steps from this page to the first class. See a full class first with a Priority Demo, or choose a plan and enrol today.
Rated 4.9 across 547 Google reviews. Monthly billing, cancel any time.
How enrolment works
See a full class first (optional)
Book a Priority Demo: a live class of about 45 to 60 minutes with a mentor reserved for you, today or tomorrow. After the class the mentor sends a written skill report and a personal learning roadmap on WhatsApp. If you enrol, the demo fee is adjusted against your first month's fee. Share your demo Order ID with us on WhatsApp and we take it off.
Book a Priority DemoDemo fee ₹499Choose a plan
Group batch (5 to 10 students), mini batch (3 to 4 students, India only) or 1-on-1 with your own mentor. Every plan is live online, and each class runs about one hour. The cards below show classes per week and the monthly fee in your currency.
Enrol and pay the first month
Press Enrol Now on your plan, fill in the student's name, email and phone, and pay through secure Razorpay checkout: UPI, cards or net banking in India, and debit or credit card from any other country.
Fix your class timings
After payment, message us on WhatsApp or call +91 91233 66161 with the student's name, the course and your preferred time slot. We confirm the batch, send the class link and schedule the first class at your chosen time.
Billing is monthly and you can cancel any time.
International Students (Outside India)
Billed monthly in US dollars, the same price in every country. Contact us with any questions.
Questions before you enrol? Talk to our team.
Ask about class timings, the right level for your child, what they need to know already, or payment. Parents and adult learners can reach us on WhatsApp, by email or by phone.
Program Overview
Statistics is the working mathematics of almost every field that touches data: business, medicine, psychology, economics, engineering, machine learning. It is also routinely taught backwards, as formula memorisation first and meaning never. This 6-month live course teaches it the other way. Months 1 and 2 build the two foundations: describing data honestly, and probability as the grammar of uncertainty, including conditional probability and Bayes' theorem worked through real cases like medical test results. Months 3 and 4 cover the distributions that model the world, then sampling, the central limit theorem seen through simulation rather than assertion, and confidence intervals interpreted the way they actually work. Month 5 is hypothesis testing done properly: t-tests, proportion tests and chi-square, with equal attention to what p-values do not say. Month 6 covers correlation and regression, then a capstone: a full analysis of a real dataset of your choosing, written up with methods and limitations.
Every technique is practised on real data in a spreadsheet, and an optional Python track runs alongside for those who want it. Neither is required knowledge coming in; one of them becomes a working skill going out.
What Makes This Program Different
- Real datasets from week 1: public health, sports, economics and business data, not textbook tables invented to make the arithmetic clean
- Spreadsheet-first with an optional Python track, so non-programmers finish everything and programmers get the pandas version of each technique
- Probability taught through consequential examples: false positives in medical testing, base-rate mistakes, and why intuition fails on conditional probability
- The central limit theorem demonstrated by simulation you run yourself, because a theorem you have watched happen is one you actually trust
- Honest inference: what a p-value is and is not, why statistical significance is not importance, and how p-hacking happens
- A capstone analysis of a dataset you choose, written up with methods and limitations like a piece of real analytical work
Your Learning Journey
Career Progression
Detailed Course Curriculum
Explore the complete week-by-week breakdown of what you'll learn in this comprehensive program.
Topics Covered
- Populations, samples and why the difference drives everything
- Types of data: categorical and numerical, and the scales of measurement
- Tidy data: rows, columns and the shape analysis expects
- Where data comes from: surveys, experiments, logs and their built-in biases
- Spreadsheet setup: importing, cleaning basics and first summaries
- Famous data failures: survivorship bias and selection bias with real stories
Projects You Build
- First dataset walk: load a real public dataset, document its variables, units and suspicious values before computing anything
Practice & Assignments
Profile two provided datasets: identify variable types, spot three data-quality problems, write one paragraph on each
Topics Covered
- Mean, median and mode, and what question each one answers
- How skew and outliers pull the mean away from the median
- Weighted means and when unweighted averages mislead
- Group comparisons: the danger of comparing averages of unequal groups
- Computing summaries in the spreadsheet with named functions
- Reading claims critically: what average salary headlines usually hide
Projects You Build
- Income exercise: a salary dataset summarised with mean and median, with a written note on why they disagree and which to report
Practice & Assignments
12 central tendency problems on real data, each answer accompanied by one sentence on which measure fits and why
Topics Covered
- Range and interquartile range
- Variance and standard deviation, built up from deviations rather than dropped as a formula
- The 1.5 IQR rule for flagging outliers
- z-scores: how unusual is this value
- Comparing variability across different units with the coefficient of variation
- Why spread is the half of the story that dashboards leave out
Projects You Build
- Consistency study: two players or products with the same average compared on spread, with a recommendation written up
Practice & Assignments
14 spread problems including 4 z-score questions, standard deviation computed once by hand and thereafter by software
Topics Covered
- Histograms and the shapes of distributions: symmetric, skewed, bimodal
- Box plots and comparing groups at a glance
- Scatter plots and the first look at relationships
- Bar charts versus histograms, and why the difference matters
- Misleading charts: truncated axes, cherry-picked windows, area distortions
- Building clean charts in the spreadsheet, with labels that earn their space
Projects You Build
- Chart audit: find one misleading chart in the wild, explain the distortion, and rebuild it honestly from the underlying data
Practice & Assignments
Build five charts from a real dataset, each with a one-line takeaway written underneath
Assessment
Month 1 checkpoint: a full descriptive analysis of a provided dataset, summaries, charts and a short written brief
Topics Covered
- Experiments, outcomes, sample spaces and events
- Probability as long-run frequency and as degree of belief
- The complement rule and the addition rule
- Mutually exclusive events versus events that overlap
- Venn diagrams that actually resolve arguments
- Simulating simple probabilities in the spreadsheet to check intuition
Projects You Build
- Simulation warm-up: estimate a dice probability by simulation, compare with the exact answer, watch the gap shrink with more trials
Practice & Assignments
16 probability problems from single events to unions, each hard one checked by a quick simulation
Topics Covered
- Conditional probability: how information changes the odds
- The multiplication rule and tree diagrams
- Independence: what it means and how to test for it
- The base-rate fallacy introduced with a real screening example
- Sampling with and without replacement
- Why P(A given B) and P(B given A) are different, and the famous confusions
Projects You Build
- Two-way table study: a real dataset cross-tabulated, with conditional probabilities read off and independence checked
Practice & Assignments
14 conditional probability problems, every tree diagram drawn before any multiplication
Topics Covered
- Bayes' theorem derived from the definition of conditional probability
- The medical test problem: why a positive result on a rare disease is usually a false alarm
- Prior, likelihood and posterior in plain language
- Natural frequencies: the counting method that makes Bayes intuitive
- Spam filters and diagnostic reasoning as everyday Bayes
- The prosecutor's fallacy and other courtroom probability errors
Projects You Build
- Bayes explainer: work the medical test problem with natural frequencies and write an explanation a friend could follow
Practice & Assignments
10 Bayes problems solved twice each, once by formula and once by counting, until the two views agree in your head
Topics Covered
- Permutations and combinations, and which one the question wants
- Discrete random variables and probability distributions
- Expected value: what fair means, and why casinos always win
- Variance of a random variable
- Expected value in decisions: insurance, warranties and lotteries
- Building a probability distribution from real frequency data
Projects You Build
- Game analysis: compute the expected value of a real lottery or carnival game and write the verdict in two sentences
Practice & Assignments
12 counting and random variable problems including 3 expected-value decisions argued in writing
Assessment
Month 2 checkpoint: a mixed probability paper from basic rules through Bayes and expected value
Topics Covered
- Bernoulli trials and the binomial conditions, checked in words
- The binomial formula and where it comes from
- Mean and variance of a binomial
- Computing binomial probabilities in the spreadsheet and, on the Python track, with scipy
- Cumulative probabilities and careful at-least versus at-most reading
- Real binomial settings: quality control, conversion rates, free-throw streaks
Projects You Build
- Conversion study: model a marketing conversion scenario as a binomial and answer three business questions with it
Practice & Assignments
14 binomial problems, the conditions checked in writing before any computation
Topics Covered
- The Poisson distribution for counts per interval: arrivals, defects, calls
- When Poisson fits and when it does not
- Poisson as a limit of the binomial, seen numerically
- The geometric distribution: waiting for the first success
- Choosing the right model: binomial, Poisson or geometric from the story
- Fitting a Poisson to real count data and judging the fit by eye
Projects You Build
- Arrivals study: fit a Poisson model to real count data, compare observed and expected counts in a table
Practice & Assignments
12 modelling problems where the first marked step is naming the right distribution and defending the choice
Topics Covered
- From histograms to density curves: probability as area
- The uniform distribution as the simplest continuous case
- The normal distribution: shape, parameters and the 68-95-99.7 rule
- Standardising and the standard normal
- Normal probabilities by software, with the table method understood once
- What is and is not normal in real data: heights yes, incomes no
Projects You Build
- Normal check: test the 68-95-99.7 rule against a real dataset and report where it holds and where it breaks
Practice & Assignments
14 normal distribution problems, each one opened with a sketch of the shaded region
Topics Covered
- Inverse problems: finding cutoffs from probabilities
- Percentiles, reference ranges and grading on a curve
- Assessing normality with histograms and quantile plots
- The normal approximation to the binomial and when it is safe
- Combining independent normal quantities
- A distribution field guide: one page mapping situations to models
Projects You Build
- Field guide build: your own one-page reference mapping real situations to binomial, Poisson, geometric, uniform or normal
Practice & Assignments
12 mixed distribution problems where the model is never announced in the question
Assessment
Month 3 checkpoint: a distributions paper mixing model choice, computation and interpretation
Topics Covered
- Simple random, stratified, cluster and systematic sampling
- Convenience samples and why most internet polls mean little
- Sampling bias, nonresponse bias and question wording effects
- Famous polling failures and what went wrong
- Randomised experiments versus observational studies
- Designing a small survey that will not embarrass you
Projects You Build
- Survey critique: take one published poll, identify its sampling method, and write three specific bias risks
Practice & Assignments
10 sampling design problems plus one short survey designed, with its weaknesses honestly listed
Topics Covered
- The sampling distribution of the mean: a distribution of statistics, not data
- Standard error and why bigger samples pin the mean down
- The central limit theorem stated carefully
- The CLT demonstrated by simulation: skewed populations, normal-looking sample means
- How sample size affects the shape, watched live
- Why the CLT is the load-bearing wall of everything that follows
Projects You Build
- CLT simulation: run the resampling experiment yourself in the spreadsheet or Python, and keep the charts as evidence
Practice & Assignments
10 standard error and sampling distribution problems, plus the simulation repeated on a second population shape
Topics Covered
- The logic of interval estimation
- z-intervals and t-intervals, and when the t-distribution is the honest choice
- Degrees of freedom in plain language
- What 95 percent confidence actually means, and the misreadings to avoid
- Interval width: the three levers of confidence, spread and sample size
- Computing and reporting intervals from real data
Projects You Build
- Interval report: a confidence interval for a real dataset's mean, reported in one correct sentence and one wrong-but-common sentence, labelled
Practice & Assignments
12 confidence interval problems, every interval followed by a correctly worded interpretation
Topics Covered
- Confidence intervals for proportions
- Margin of error and how polls report it
- Sample size calculations: how many people do we actually need
- Reading polling small print: confidence level, margin, population
- Intervals for differences, previewed
- Estimation recap: the full toolkit so far, organised
Projects You Build
- Poll deconstruction: take a real published poll and verify its stated margin of error from its sample size
Practice & Assignments
12 proportion and sample size problems including two taken from real published surveys
Assessment
Month 4 checkpoint: an estimation paper from sampling design through confidence intervals, interpretation marked as strictly as computation
Topics Covered
- Null and alternative hypotheses: the courtroom analogy done carefully
- Test statistics and the p-value defined precisely
- Significance levels and the arbitrary honesty of 0.05
- Type I and Type II errors, and which one your situation fears more
- What a p-value is not: not the probability the null is true
- One-tailed versus two-tailed tests and how to choose before seeing data
Projects You Build
- Error analysis: for three real scenarios, name both error types and argue which is costlier in each
Practice & Assignments
10 test-logic problems with no computation at all: hypotheses, tails and error types only
Topics Covered
- The one-sample t-test for a mean, start to finish
- The one-sample proportion test
- Checking conditions before trusting the test
- Computing tests in the spreadsheet and, on the Python track, with scipy
- Writing conclusions in context, with the p-value reported not worshipped
- Confidence intervals and tests as two views of the same evidence
Projects You Build
- Claim check: test a real advertised claim against real or provided data, and write the verdict in three sentences
Practice & Assignments
12 one-sample tests, each conclusion written in context and checked against its confidence interval
Topics Covered
- Independent two-sample t-tests
- Paired tests and recognising paired designs
- Two-proportion tests: the A/B test in its natural form
- Effect size: statistically significant versus actually important
- How A/B testing works in product teams, and where it goes wrong
- Reading a published study's methods section without fear
Projects You Build
- A/B analysis: a realistic conversion dataset analysed end to end, with a recommendation that weighs effect size, not just p
Practice & Assignments
12 two-group problems including one paired design hiding among independent ones
Topics Covered
- Chi-square goodness of fit: does the data match the claimed distribution
- Chi-square test of independence on two-way tables
- Expected counts and when the test is valid
- Multiple comparisons: why testing twenty things finds one false discovery
- p-hacking and publication bias: how honest people fool themselves
- Pre-registering your question: deciding what to test before looking
Projects You Build
- Independence study: a real two-way table tested for independence with the full expected-count working shown
Practice & Assignments
10 chi-square problems plus a written half-page on one real p-hacking case
Assessment
Month 5 checkpoint: a full inference paper across one-sample, two-sample and chi-square tests, conclusions marked for wording
Topics Covered
- Covariance and the Pearson correlation coefficient
- What r measures and the linear-only caveat
- Anscombe's quartet: four datasets, one r, four different stories
- Correlation is not causation, with the confounder named each time
- Rank correlation for curved but monotonic relationships
- Computing and charting correlations across a real dataset
Projects You Build
- Correlation hunt: find the three strongest relationships in a real dataset, chart them, and flag which might be confounded
Practice & Assignments
10 correlation problems, every claim of relationship backed by a scatter plot
Topics Covered
- The least squares line: what is being minimised and why
- Interpreting slope and intercept in the units of the problem
- R-squared: how much variation the line explains
- Residual plots: the honesty check most analyses skip
- Prediction within range versus extrapolation beyond it
- Multiple regression previewed: several predictors at once, and its dangers
Projects You Build
- Prediction model: fit a regression on real data, check residuals, make two predictions and state their limits
Practice & Assignments
10 regression problems with slope interpretations written in context every time
Assessment
Capstone gate: analysis plan approved, dataset, question, methods and chosen track (spreadsheet or Python)
Topics Covered
- Framing an answerable question before touching the data
- Cleaning and documenting the dataset
- Choosing methods that fit the data, not the other way around
- Descriptive pass first: summaries and charts before any test
- Running the inference or regression the question calls for
- Instructor review checkpoint mid-build
Projects You Build
- Capstone analysis in progress: the full pipeline from raw data to preliminary findings, on your own chosen dataset
Practice & Assignments
Capstone work sessions with a written progress note after each: what was found, what is uncertain, what is next
Topics Covered
- Structuring an analysis report: question, data, methods, findings, limitations
- Writing limitations honestly: what your analysis cannot claim
- Charts chosen for the reader, not the author
- Presenting analytical work in ten minutes
- Answering methods questions about your own work
- Where to go next: deeper statistics, Python for data, or machine learning
Projects You Build
- Completed capstone: a written analysis report and a short presentation, delivered to the class and kept for your portfolio
Practice & Assignments
Final report polish plus a dry-run presentation with peer questions
Assessment
Capstone review: report and presentation assessed on method, honesty of interpretation and clarity, plus certificate review
Projects You'll Build
Build a professional portfolio with A portfolio of small real-data studies plus one complete capstone analysis with report and presentation real-world projects.
Weekly Learning Structure
Certification & Recognition
Technologies & Skills You'll Master
Comprehensive coverage of the entire modern web development stack.
Support & Resources
Career Outcomes & Opportunities
Transform your career with industry-ready skills and job placement support.
Prerequisites
Who Is This Course For?
Career Paths After Completion
Salary & Market Context
The ranges below are general market salary bands for roles where statistics is a core skill, in India and abroad, drawn from public industry data. They are shown for career context only and are not a promise or guarantee of income. Actual pay depends on your skills, experience, location, and the job market.
Course Guarantees
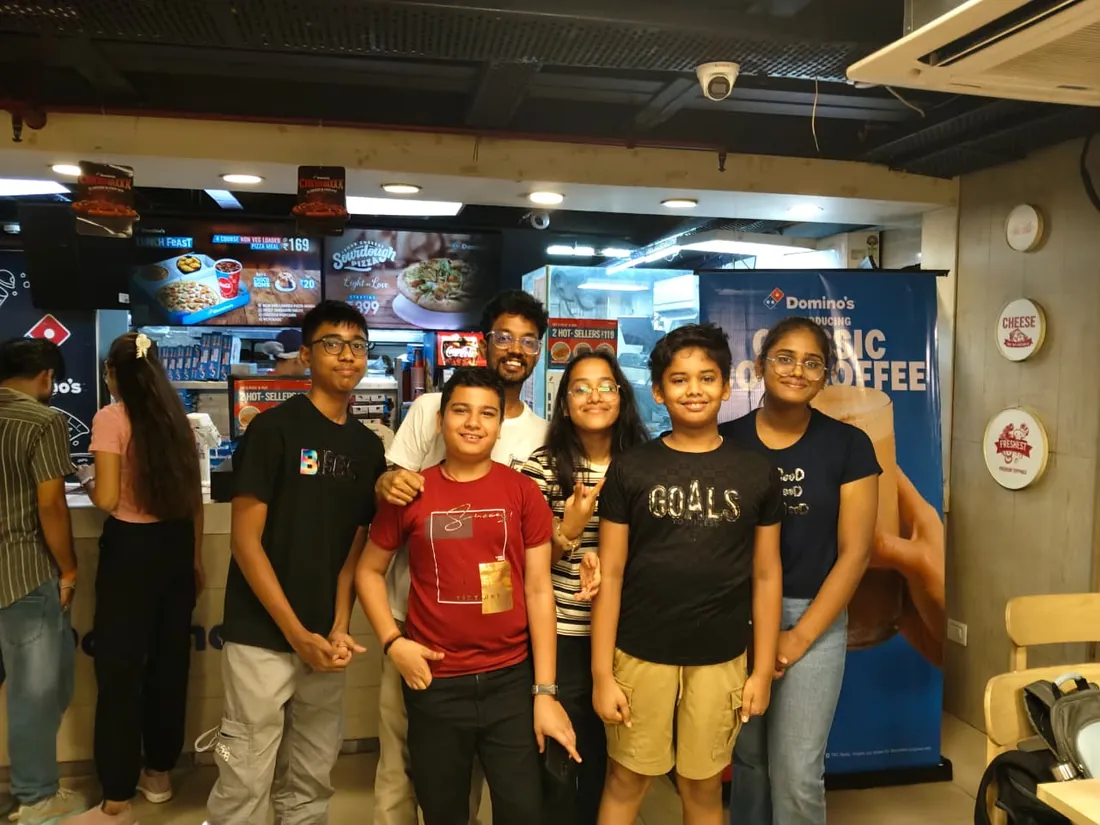
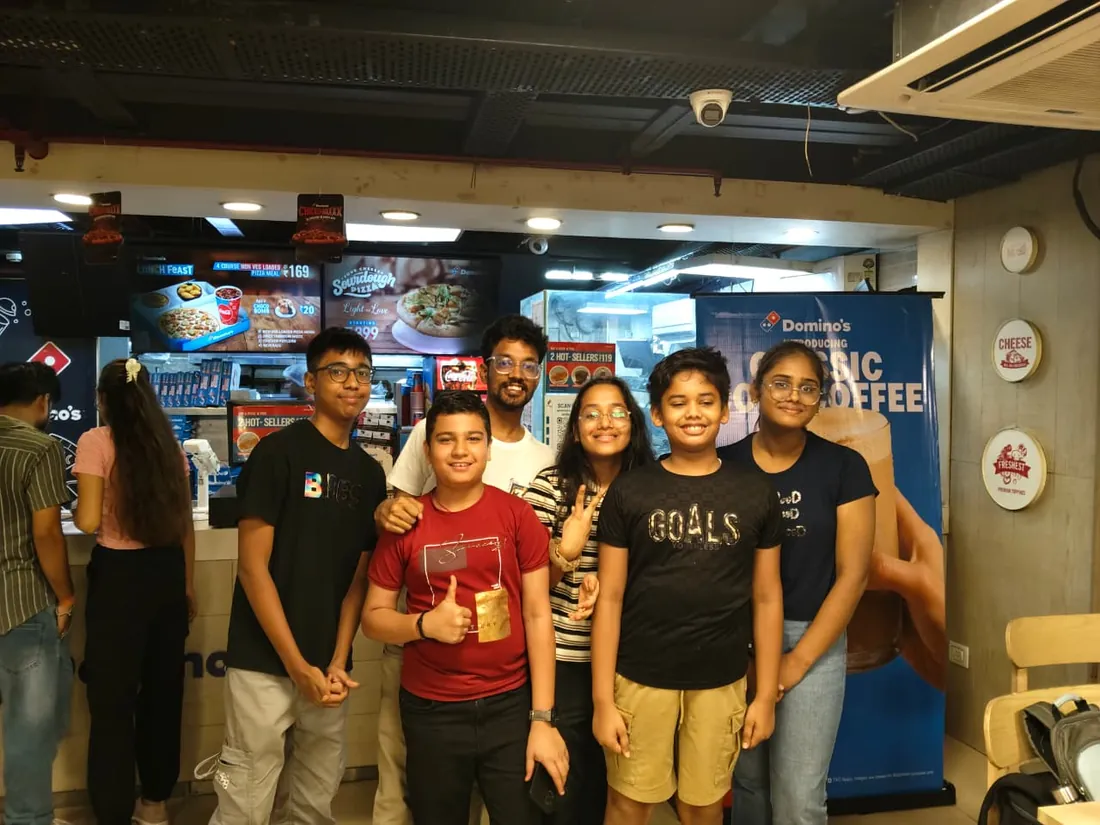
Real students. Real moments. Real joy.
These are our actual student meetups. No stock photos, no filters. Swipe through and meet the community you'll be joining.





































What families say
Straight from the parents and students who learn with us. Rated 4.9 across 547 Google reviews.
“Mivaan enjoys the class. He understands the concepts and completes his tasks with excitement. He started taking interest in coding… truly amazing class.”
“I absolutely love it here! I made new friends and learned important valuable coding skills while having the fun of my life. It's not just coding here, it's outings, bonding and most importantly preparing you for your future. Definitely five stars.”
“What stands out most is how excited my son is before every class. He looks forward to learning, problem-solving, and sharing what he's built. I've noticed a big boost in his confidence!”
“Modern Age Coders has been a game-changer for me! I struggled to grasp IT concepts and coding before joining, but their classes transformed everything. I'm now the topper in my class and can confidently write complex programs with ease.”
“Modern Age Coder have wonderful teachers who teach in a clear, easy and practical way. The teacher boosts students' confidence, keeps them updated with technology, and inspires them to learn without hesitation.”
“The one step solution for my son. Modern Age Coders make learning coding so simple that kids love it.”
“Coding classes here make learning very interesting and conceptual. The teachers teach us in a very easy-to-understand and efficient manner.”
“One of the most wonderful education centres out there. Education is not limited to school syllabus but focuses on skill development. Learning here has been a wonderful journey and still continuing.”
“I highly recommend this computer coding class! The teachers are incredibly knowledgeable and passionate about coding. They make every session engaging and insightful.”
“My child Dhairya is really enjoying the Modern Age Coder IT classes. This is his first online class, and he eagerly looks forward to it.”
“Very good classes. Don't worry about coding. They teach the best, especially Shivam sir.”
“Very good classes. Makes learning very easy and interactive.”
Hear it from our students
Real parents and students in their own words, on our public YouTube channel.
Straight answers about Statistics & Probability: Data to Hypothesis Testing
- Who should take this course?
- College students and working professionals; no programming required. It suits students in commerce, economics, psychology, biology or engineering whose degrees assume statistics that was never properly taught; analysts, marketers, product managers and operations people who face dashboards and a/b tests daily and want to stop nodding along; people headed for data science or machine learning who know the statistics half is the half they are missing.
- What will they learn and build?
- Statistics is the working mathematics of almost every field that touches data: business, medicine, psychology, economics, engineering, machine learning. It is also routinely taught backwards, as formula memorisation first and meaning never. This 6-month live course teaches it the other way.
- How deeply are topics covered?
- The course runs 6 months (24 weeks) at 2 live classes/week + 3-4 hours practice, across 3 phases listed week by week in the syllabus below. A structured, well-paced curriculum taught step by step, with hands-on practice in every session.
- Who teaches it?
- Modern Age Coders mentors, who teach the live classes themselves. You can watch them at work in the free class recordings before you decide.
- How do practice, feedback and assessment work?
- Classwork every session, a problem set after every class, monthly reviews that mix in earlier topics, and a final exam covering the whole course that decides the certificate: real understanding, with a free retest after revision if needed. Doubt support between classes over WhatsApp, so you are never left stuck. A certificate you earn by passing the final assessment, with a free retest after revision if needed.
- What does it cost?
- Three monthly plans: a group batch, a mini batch and 1-on-1. Prices are shown in your currency in the plans section. Monthly billing, cancel any time.
- When can classes take place?
- Live classes are scheduled around your week. Group batches meet at a fixed weekly slot; 1-on-1 students choose their own. International students are scheduled in their own timezone. Ask on WhatsApp for the current slots.
- Can I watch the teaching before deciding?
- Yes. Full recordings of real 13 and up classes are free to watch, free with a Google sign-in. These recordings show how we teach, not the exact syllabus of this course. Some classes are in English and some in Hindi; everyone follows at their own pace. Watch a class end to end, like you are in it. Sessions are interactive and each moment builds on the last.
- Can I enroll without a live demo?
- Yes. Choose a plan on this page and enrol directly; a demo is not required. If you would like to see a full class with a mentor first, book a Priority Demo.
- How do I reach you with a question?
- WhatsApp +91 91233 66161, email connect@modernagecoders.com, or call +91 91233 66161. Tell us the student's age and what they have learned so far, and we will point you to the right plan and batch.
Common Questions About Statistics & Probability: Data to Hypothesis Testing
Get answers to the most common questions about this comprehensive program
Still have questions? We're here to help!
Contact UsRelated Courses You May Like
Continue your learning journey with these recommended programs
 Data Science Mathematics
Maths for Data Science: Statistics, Linear Algebra and ML
Maths for data science, live online: statistics, probability, linear algebra, regression, ML mathema...
Explore Course Programming
Java Course for College: Core Java to Spring Boot
Java course for college students and professionals: core Java, collections and concurrency, then Spr...
Explore CourseRelated Articles & Guides
Deepen your knowledge with these hand-picked articles
 Education
8 min read
Education
8 min read
Coding is the New English: Why 2026 is the Year to Start
Coding is as essential as English today. Discover why 2026 is the perfect year to start and how it o...
Read Article Education
9 min read
Education
9 min read
Common Myths About Coding for School Students (And the Truth Behind Them)
Debunking coding myths for students. From 'coding is only for geniuses' to 'it's too late', the trut...
Read ArticleReady to start Statistics & Probability: Data to Hypothesis Testing?
Book a Priority Demo to see a full live class with a mentor reserved for you, today or tomorrow. Or choose a plan and enrol now.
Questions? WhatsApp +91 91233 66161 or email connect@modernagecoders.com