Data Science for Teens
Real datasets, honest charts, and a first machine learning model that the student can actually explain.
Syllabus updated August 2026
Questions? WhatsApp +91 91233 66161 or email connect@modernagecoders.com
Recordings are free with a Google sign-in. These recordings show how we teach, not the exact syllabus of this course.
Our promise
The world's best learning experience, open to everyone.
- World-class instructorsEvery class is taught by an instructor who specialises in that exact field.
- No compromise on qualityEvery lesson, project and piece of feedback is held to the highest standard.
- Education for everyoneLearners aged 6 to 67, from first-time beginners to working professionals, in 25+ countries.
If you want the highest quality, Modern Age Coders is the right choice.
Book a Priority DemoHow long this course takes
This course runs 6 months (24 weeks) at 2 live classes/week + 2-3 hours practice. The range allows for background and pace: a complete beginner uses the full span, and a student with prior knowledge finishes sooner. The syllabus below is planned to the shorter end, with margin kept for revision.
For personalised duration planning, call +91 91233 66161 and we'll map a schedule to your goals.
At a glance
- Who it is for
- Ages 14 to 18, basic Python required. Age: 14 to 18, matched to the reasoning and statistics content.
- Prerequisites
- Required: variables, loops, functions, and lists. Our Python for Teens course is the natural on-ramp if these are missing
- Format
- Live, interactive classes with a real instructor, never pre-recorded videos. Live classes run about one hour.
- Language
- English or Hindi, depending on the batch.
- Duration
- 6 months (24 weeks)
- Weekly commitment
- 2 live classes/week + 2-3 hours practice
- Class size
- Group batches of 5 to 10 students, mini batches of 3 to 4, or 1-on-1.
- Certificate
- Certificate from Modern Age Coders, awarded on passing the final assessment
- Watch first
- Free recordings of real classes for ages 13 and up, free with a Google sign-in. These recordings show how we teach, not the exact syllabus of this course.
- Live demo
- Optional. Enrol directly on this page, or book a Priority Demo: a full live class of about 45 to 60 minutes with a mentor reserved for you.
- Questions
- WhatsApp +91 91233 66161 or email connect@modernagecoders.com.
How we teach
Deep understanding. Real projects. Expert guidance.
Learn coding, AI and maths through careful explanations, practical demonstrations, and hands-on problem-solving. Our instructors guide you from the foundations to advanced ideas, helping you understand what happens, why it happens, and how to build it yourself.
You will explore concepts step by step, write and improve code, investigate mistakes, ask questions, and apply your knowledge to meaningful projects. Lessons are designed around active participation, thoughtful feedback, and growing independence.
Expert-led live teaching, with practical participation built into every lesson.
- Students explain their thinking.
- Instructors demonstrate, then guide practice.
- Learners code, solve, or build during lessons.
- Questions and misconceptions get attention.
- Assignments receive useful feedback.
- Progress is checked before advancing.
How to join Data Science for Teens: Python & Your First ML Models
Four steps from this page to the first class. See a full class first with a Priority Demo, or choose a plan and enrol today.
Rated 4.9 across 547 Google reviews. Monthly billing, cancel any time.
How enrolment works
See a full class first (optional)
Book a Priority Demo: a live class of about 45 to 60 minutes with a mentor reserved for you, today or tomorrow. After the class the mentor sends a written skill report and a personal learning roadmap on WhatsApp. If you enrol, the demo fee is adjusted against your first month's fee. Share your demo Order ID with us on WhatsApp and we take it off.
Book a Priority DemoDemo fee ₹499Choose a plan
Group batch (5 to 10 students), mini batch (3 to 4 students, India only) or 1-on-1 with your own mentor. Every plan is live online, and each class runs about one hour. The cards below show classes per week and the monthly fee in your currency.
Enrol and pay the first month
Press Enrol Now on your plan, fill in the student's name, email and phone, and pay through secure Razorpay checkout: UPI, cards or net banking in India, and debit or credit card from any other country.
Fix your class timings
After payment, message us on WhatsApp or call +91 91233 66161 with the student's name, the course and your preferred time slot. We confirm the batch, send the class link and schedule the first class at your chosen time.
Billing is monthly and you can cancel any time.
International Students (Outside India)
Billed monthly in US dollars, the same price in every country. Contact us with any questions.
Questions before you enrol? Talk to our team.
Ask about class timings, the right level for your child, what they need to know already, or payment. Parents and adult learners can reach us on WhatsApp, by email or by phone.
Program Overview
Data science is the rare school-age subject where the professional tools are free and the real material, actual datasets about movies, sport, cities, and climate, is sitting in public archives waiting to be questioned. This 6-month live course teaches teens to do the real thing: load data with pandas, clean it honestly, chart it with matplotlib without lying, reason about it with statistics, and finally train first machine learning models with scikit-learn and understand what they did.
The course is deliberately anti-hype. Students learn that most of data science is careful cleaning and honest questions, that a chart can mislead and how not to let it, and that a model is only as good as the data and the person reading its results. It ends with a data-story capstone: each student picks a question they care about, finds the data, does the analysis end to end, and presents a notebook that shows their reasoning. Basic Python is required; our Python for Teens course is the natural on-ramp for students who need it.
What Makes This Program Different
- Real public datasets from the second month: movies, sports seasons, city open data, and climate records, not sanitized textbook tables
- A whole month on cleaning, because that is the actual job, and students learn to log every cleaning decision like professionals
- Honest charts are treated as an ethical skill: a full lesson on how visualizations mislead and how to avoid it
- Statistics taught for use, not for the exam: when the mean lies, what correlation does not prove
- Machine learning arrives late and lands properly: train-test splits and simple models the student can explain, not black-box demos
- The capstone is a question the student chose, answered end to end in a notebook they present and publish
Your Learning Journey
Career Progression
Detailed Course Curriculum
Explore the complete week-by-week breakdown of what you'll learn in this comprehensive program.
Topics Covered
- Google Colab and Jupyter notebooks: why data work lives in cells, not scripts
- Refresh: variables, lists, and dictionaries through data-flavored exercises
- Refresh: loops and conditionals over collections of records
- Markdown cells: notes and reasoning next to code
- Notebook habits: run order, restarts, and the stale-state trap
- The course map: where pandas, charts, and models fit
Projects You Build
- Class survey analysis, round one: collect a small class survey and answer three questions about it with plain Python
Practice & Assignments
12 refresh exercises on lists and dictionaries, all phrased as data questions
Topics Covered
- Refresh: writing and calling functions that transform data
- Reading files: opening a CSV by hand with the csv module
- What a CSV actually is: rows, delimiters, and headers
- Building lists of dictionaries from raw rows
- Writing results back out to a file
- Why this manual work matters: understanding what pandas automates
Projects You Build
- Hand-rolled report: read a 500-row CSV with plain Python and compute totals, averages, and a top-five list
Practice & Assignments
Write three reusable functions: load a CSV, filter rows by a condition, summarize a column
Topics Covered
- Rows as records, columns as variables: the table mental model
- Data types in the wild: numbers, text, dates, and categories
- First contact with messy data: a deliberately imperfect dataset
- Questions data can answer, and questions it cannot
- From question to query: translating curiosity into precise operations
- Sources of real data: open data portals and public archives, toured live
Projects You Build
- Question workshop: pick a public dataset, write five precise questions about it, and classify which are answerable from the columns present
Practice & Assignments
Find one dataset about something you personally care about and describe its rows, columns, and types
Topics Covered
- Arrays vs lists: what NumPy is for
- Vectorized operations: arithmetic on whole columns at once
- Useful reductions: sum, mean, min, max, and where they mislead
- Boolean masks: selecting data with conditions, the idea pandas is built on
- A speed demonstration: the same computation with a loop and with NumPy
- Reading NumPy errors without panic
Projects You Build
- Class survey analysis, round two: redo week 1's analysis in NumPy and compare the code side by side
Practice & Assignments
10 NumPy exercises: masks, reductions, and column arithmetic on a provided dataset
Assessment
Month 1 check: live notebook exercise combining functions, file reading, and NumPy on a fresh dataset
Topics Covered
- Series and DataFrames: pandas's two shapes
- Loading CSVs with read_csv and its most useful options
- First-look tools: head, info, describe, and shape
- Selecting columns and rows: loc and iloc without the usual confusion
- Column arithmetic: creating new columns from old ones
- Saving your work: to_csv and keeping raw data untouched
Projects You Build
- First pandas notebook: load a movies dataset and produce a profile of it, size, columns, types, and five first findings
Practice & Assignments
Load three different datasets and write a three-line profile of each
Topics Covered
- Boolean masks in pandas: rows matching a condition
- Combining conditions: and, or, and the parentheses that matter
- isin, between, and string contains for readable filters
- Sorting by one and several columns
- nlargest and nsmallest: top-N questions answered directly
- Chaining operations without losing readability
Projects You Build
- Movie interrogation: answer ten ranked questions about the movies dataset, best-rated per decade, longest, most profitable, each as a clean filtered result
Practice & Assignments
Write and answer eight filter questions of your own on a sports dataset
Topics Covered
- value_counts: the fastest first answer in pandas
- groupby: split, apply, combine, drawn before coded
- Aggregations: mean, sum, count, and multiple at once with agg
- Grouping by more than one column
- Sorting grouped results to find leaders and outliers
- Pivot tables, gently: the spreadsheet idea in pandas form
Projects You Build
- Season in review: full statistical breakdown of a sports season, per team and per month, from a raw match-results dataset
Practice & Assignments
Answer six groupby questions on a dataset of your choice and mark the most surprising result
Topics Covered
- concat: stacking datasets that share columns
- merge: joining tables on a shared key, with the four join types in pictures
- What gets lost in a join: rows that match nothing
- Checking a merge: row counts before and after
- Tidying column names and types after combining
- The month project workflow: load, join, group, answer
Projects You Build
- Two-table analysis: join two related datasets, for example city populations with air quality readings, and answer three questions no single table could
Practice & Assignments
Perform one merge on new data and write two sentences on rows that failed to match and why
Assessment
Month 2 check: timed pandas practical, six questions on an unseen dataset, filters through joins
Topics Covered
- Finding the holes: isna, counts, and missingness patterns
- Why data goes missing, and why the reason changes the fix
- Dropping rows or columns: when it is honest and when it hides too much
- Filling values: constants, means, medians, and the trade-offs of each
- The cleaning log: recording every decision and its justification
- Raw data stays raw: cleaned copies, never overwritten originals
Projects You Build
- Missing-value audit: map the missingness of a real open dataset, choose treatments per column, and defend each in your cleaning log
Practice & Assignments
Apply two different missing-value strategies to the same column and compare how the summary statistics move
Topics Covered
- Numbers trapped in text: currency symbols, commas, and units
- String repair with .str methods: strip, replace, lower, split
- Dates done right: to_datetime and what it makes possible
- Categories with typos: Delhi, delhi, and DELHI as one value
- astype and coercion errors: reading what pandas is telling you
- A repair pipeline: ordered, rerunnable cleaning steps in one notebook section
Projects You Build
- Type rescue: take a scraped price-and-date dataset where every column is text and restore true types, documenting each repair
Practice & Assignments
Fix eight prepared dirty columns, one repair function each
Topics Covered
- Spotting outliers: sorting, describe, and quick plots
- Error or truth: the 190-year-old customer vs the genuine billionaire
- Duplicates: exact, partial, and the drop_duplicates decisions
- The ethics of cleaning: every removal changes the conclusion
- Documenting judgment calls so others can disagree with you fairly
- Sanity checks: totals and counts that must still make sense after cleaning
Projects You Build
- Judgment file: on a dataset seeded with ambiguous outliers and duplicates, decide keep or remove case by case, with one-line justifications
Practice & Assignments
Trade judgment files with a classmate and write where you disagreed and why
Topics Covered
- A genuinely messy public dataset, start to finish
- Planning the clean: audit first, repair second, verify third
- Combining the month: missingness, types, strings, outliers, duplicates
- Writing the cleaning log as a professional document
- Before-and-after: quantifying what the clean changed
- Delivering an analysis-ready dataset someone else could trust
Projects You Build
- Full cleaning project: raw city open data, for example street trees or road accidents, taken from download to documented, analysis-ready form
Practice & Assignments
Run your cleaned dataset through five sanity checks and record the results
Assessment
Month 3 check: cleaning log review plus a defense of three judgment calls in a short viva
Topics Covered
- The anatomy of a figure: axes, ticks, labels, title, legend
- Line charts: change over time, done cleanly
- Bar charts: comparing categories without clutter
- Scatter plots: two variables meeting for the first time
- Labeling as a duty: a chart must explain itself
- Plotting straight from pandas, and when to drop to matplotlib
Projects You Build
- Three-chart notebook: one line, one bar, one scatter from your cleaned month 3 dataset, each fully labeled
Practice & Assignments
Recreate two published charts from their underlying data as closely as you can
Topics Covered
- Histograms: seeing the shape of a column
- Bin sizes and how they change the story
- Box plots: medians, quartiles, and outliers at a glance
- Comparing groups: side-by-side boxes and grouped bars
- Choosing the chart from the question, not from habit
- The chart-choice checklist: comparison, trend, distribution, relationship
Projects You Build
- Distribution study: profile three numeric columns with histograms and box plots, and write what each shape reveals
Practice & Assignments
For six written questions, name the right chart type and justify it in one line each
Topics Covered
- How charts mislead: truncated axes, cherry-picked windows, and area tricks
- Fixing a misleading chart without hiding the real pattern
- Multi-panel figures with subplots
- Color with intent: highlighting one series, not decorating all of them
- Annotating the point: arrows and text that guide the reader
- Exporting print-quality figures
Projects You Build
- Mislead and repair: take one truthful chart, make the most misleading legal version of it, then write the repair, a before-and-after pair
Practice & Assignments
Find one misleading chart in real media and write a three-sentence critique
Topics Covered
- Narrative order: charts arranged as an argument
- One message per chart: trimming everything else
- Writing connective text between figures
- The takeaway figure: your single most important chart
- Presenting figures aloud: saying what to look at
- Peer review: reading a classmate's story cold
Projects You Build
- Mini data story: a four-chart narrative on a dataset of your choice, presented live in five minutes
Practice & Assignments
Revise your story after peer feedback and note the two changes that most improved it
Assessment
Month 4 check: data story presentation, graded on chart choice, honesty, and clarity
Topics Covered
- Mean, median, and mode: three centers, three stories
- When the mean lies: income, house prices, and skew
- Spread: range, quartiles, and standard deviation as a feel, not a formula
- Percentiles: where a value really stands
- Summaries that hide things: same mean, wildly different data
- Writing statistical sentences that a non-technical reader cannot misread
Projects You Build
- Two-summary exercise: describe the same real dataset once to flatter it and once to be fair, then annotate the tricks in the flattering version
Practice & Assignments
Compute and interpret full summaries for three columns of your capstone-candidate dataset
Topics Covered
- Correlation as a number: direction and strength on a scatter plot
- Computing correlations in pandas and reading a correlation matrix
- Correlation is not causation: the argument, with famous spurious examples
- Confounders: the hidden third variable, explained through cases
- When correlation is still useful despite the traps
- Reporting a relationship without overclaiming it
Projects You Build
- Correlation hunt: find the three strongest relationships in a real dataset, then argue for each whether causation is even plausible
Practice & Assignments
Find one spurious correlation in the wild or in the class archive and explain the likely confounder
Topics Covered
- What learning from data means, without mystique
- Features and targets: framing a prediction question
- The train-test split: why we grade models on unseen data
- Linear regression with scikit-learn: fit, predict, inspect
- Reading the model: coefficients as the story it learned
- Error metrics that mean something: how wrong is the model, in real units
Projects You Build
- Price predictor: train a linear regression on a real housing or used-car dataset and report its typical error honestly
Practice & Assignments
Add one feature to your model, remeasure the error, and write whether it earned its place
Topics Covered
- Classification vs regression: predicting a label instead of a number
- k-nearest neighbors: the friendliest first classifier
- Decision trees: models you can read as rules
- Accuracy and its limits: the imbalanced-classes trap
- The confusion matrix: seeing which mistakes the model makes
- Overfitting: memorizing vs learning, in one intuitive demonstration
Projects You Build
- Penguin classifier: train and compare k-nearest neighbors and a decision tree on the Palmer Penguins dataset, with a confusion matrix for each
Practice & Assignments
Break your classifier on purpose by shrinking training data, and chart accuracy against training size
Assessment
Month 5 check: statistics and modeling quiz plus a live reading of your own model's results
Topics Covered
- Choosing a question you actually care about: sport, music, games, city, climate
- Dataset hunting: Kaggle, open data portals, and evaluating what you find
- Feasibility: does this data contain an answer to this question
- Scoping to six weeks of classes: the honest project plan
- Setting up the capstone notebook: sections for question, data, cleaning, analysis, conclusion
- Instructor sign-off on question, dataset, and plan
Projects You Build
- Approved capstone plan: question, dataset, feasibility notes, and a week-by-week checklist
Practice & Assignments
Complete the data audit of your chosen dataset: size, columns, types, missingness
Topics Covered
- Cleaning your capstone data with a proper cleaning log
- Exploratory analysis: groupbys and filters chasing the question
- First figures: charting what the exploration surfaces
- Mid-sprint review with the instructor: findings so far, gaps remaining
- Following surprises: when the data disagrees with your hunch
- Keeping the notebook readable while you work fast
Projects You Build
- Capstone core analysis: cleaned data, exploratory findings, and first draft figures in the notebook
Practice & Assignments
Write your three strongest preliminary findings, each backed by one figure
Topics Covered
- Deciding whether a model helps your question or just decorates it
- If modeling: framing, training, and honest error reporting
- Assembling the narrative: question, data, cleaning, findings, conclusion
- Limitations sections: what your analysis cannot claim, stated plainly
- Polishing figures to month 4 standard
- Dry-run presentations with peer feedback
Projects You Build
- Complete capstone notebook: full narrative from question to conclusion, with a limitations section, model included only if it earns its place
Practice & Assignments
Run your dry-run presentation for a family member and note the question that stumped you
Topics Covered
- The final presentation: five minutes, the question, three findings, one takeaway figure
- Fielding questions about your own analysis
- Publishing the notebook to GitHub so it has a public address
- Writing the README: question, data source, and what you found
- Where this goes next: deeper ML, statistics, and college coursework
- Certificates and course close
Projects You Build
- Published capstone: notebook live on GitHub, presented to the class and families
Practice & Assignments
Send your published notebook to one teacher or mentor outside the course
Assessment
Capstone assessment: presentation, notebook quality, cleaning log, and honesty of claims
Projects You'll Build
Build a professional portfolio with 12+ analysis projects, ending with a published capstone notebook on GitHub real-world projects.
Weekly Learning Structure
Certification & Recognition
Technologies & Skills You'll Master
Comprehensive coverage of the entire modern web development stack.
Support & Resources
Career Outcomes & Opportunities
Transform your career with industry-ready skills and job placement support.
Prerequisites
Who Is This Course For?
Career Paths After Completion
Course Guarantees
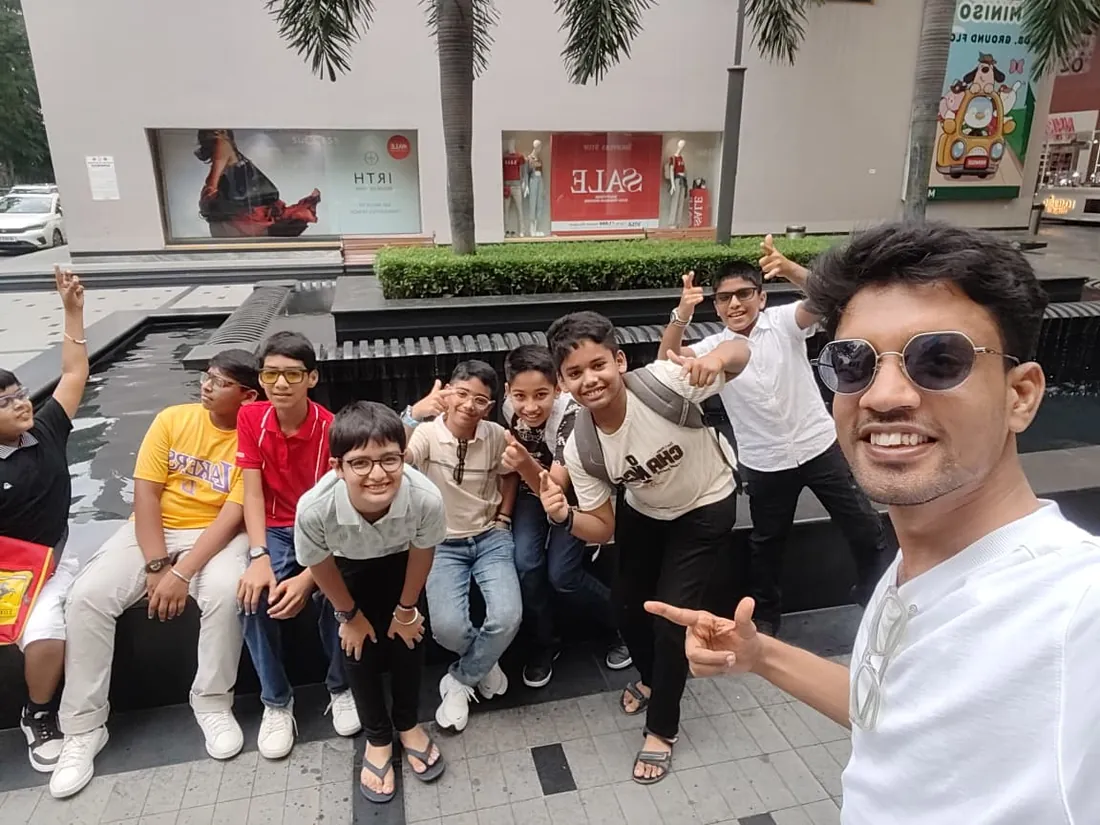
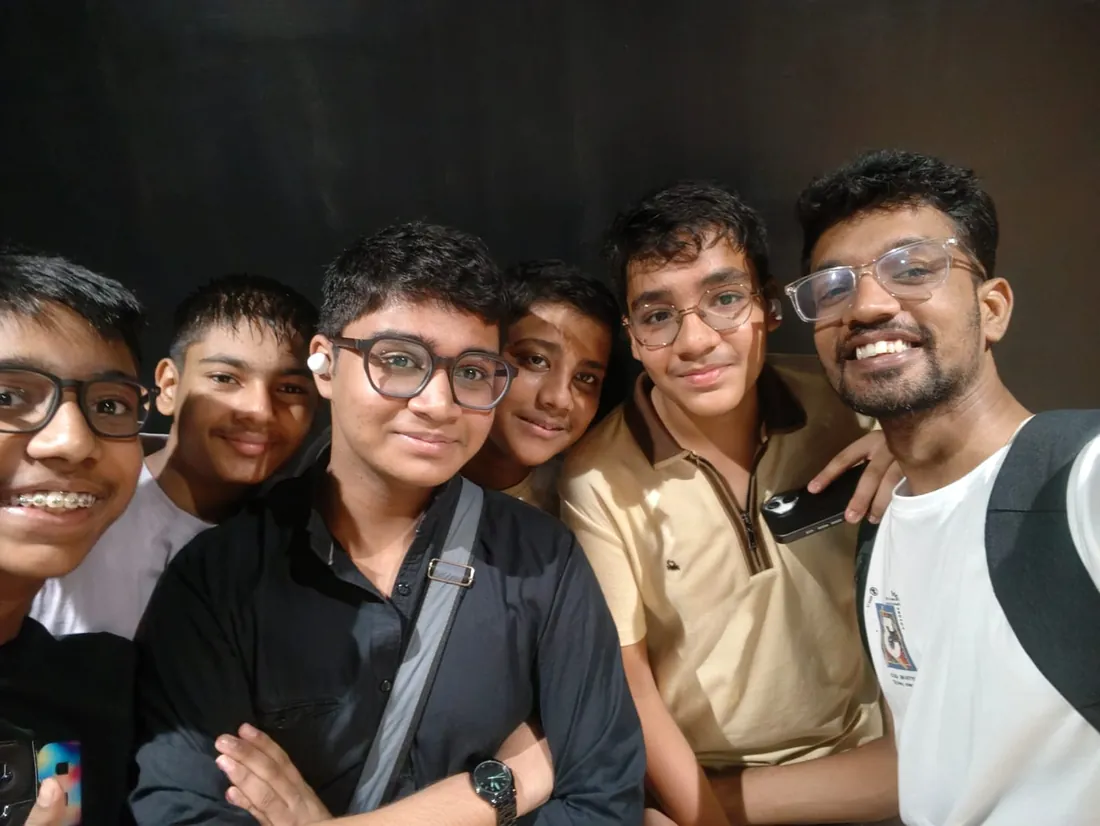
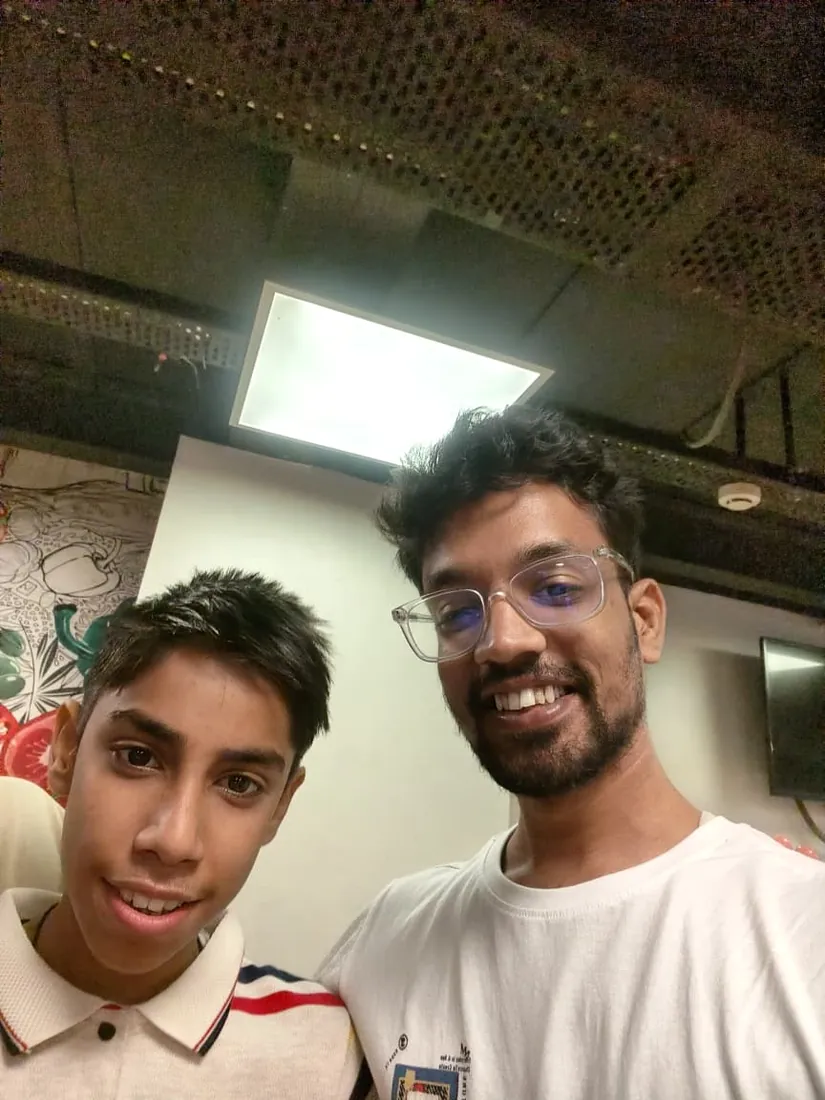
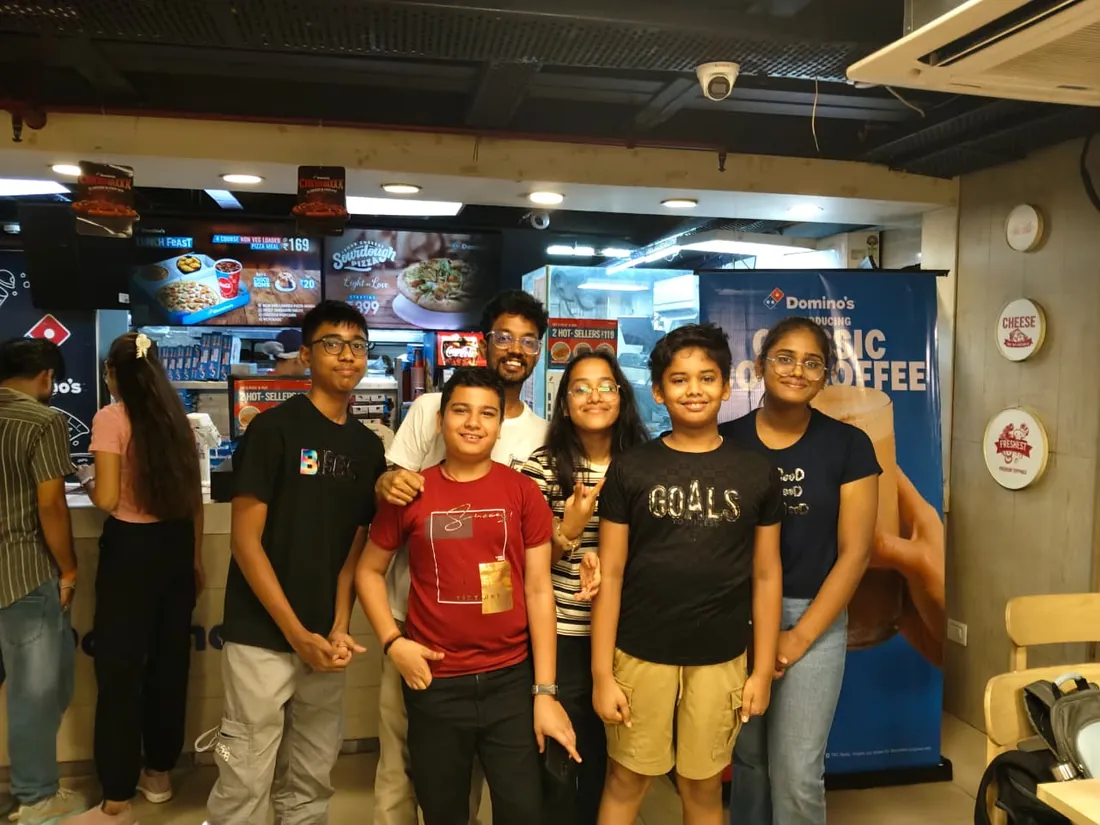
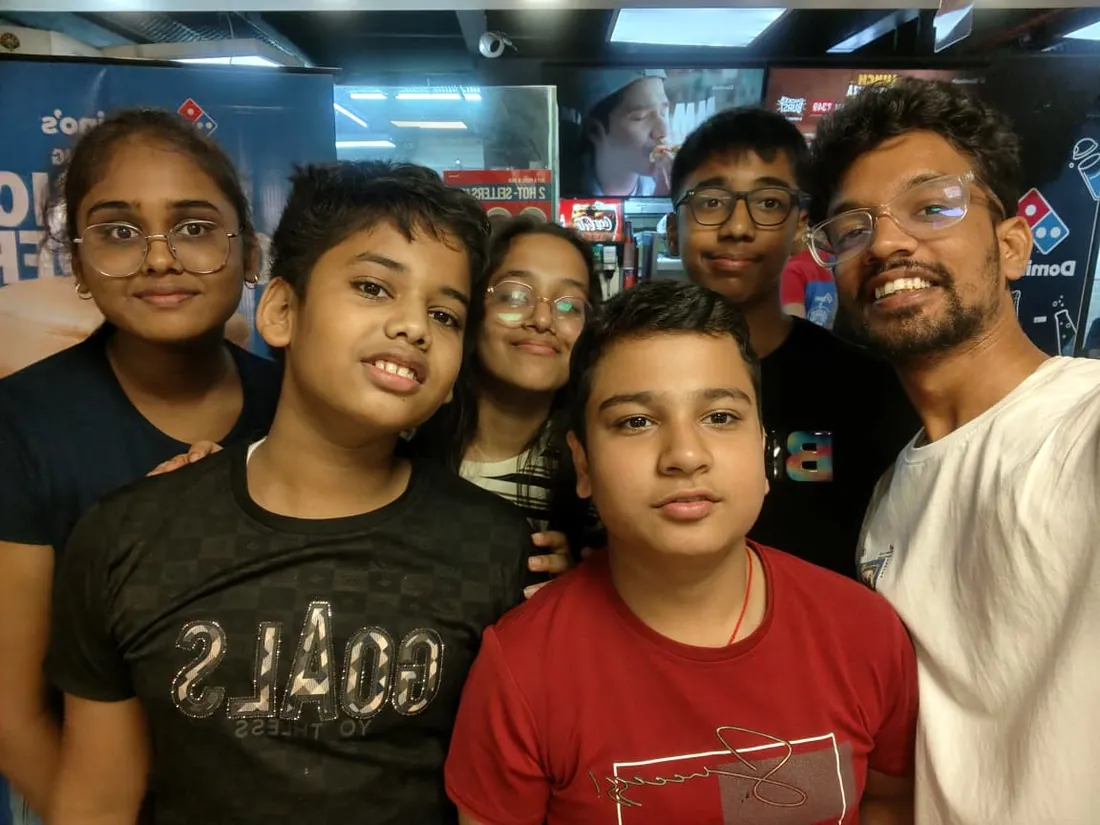
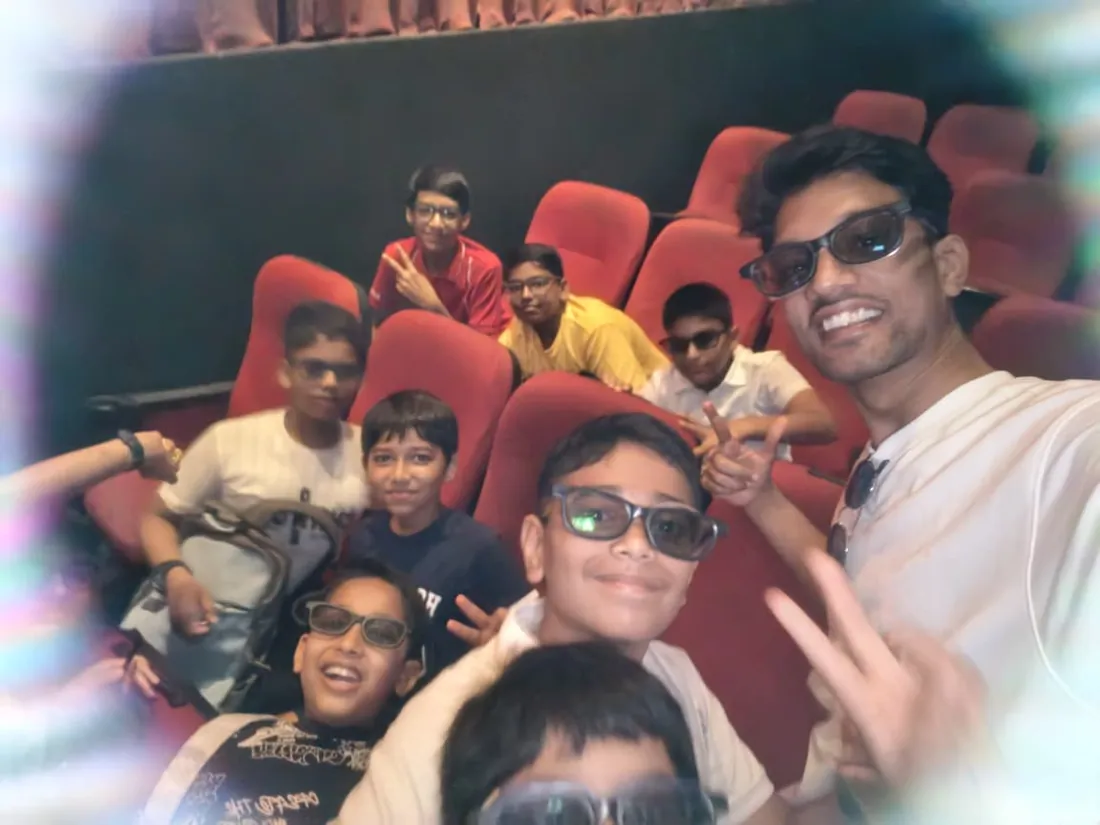
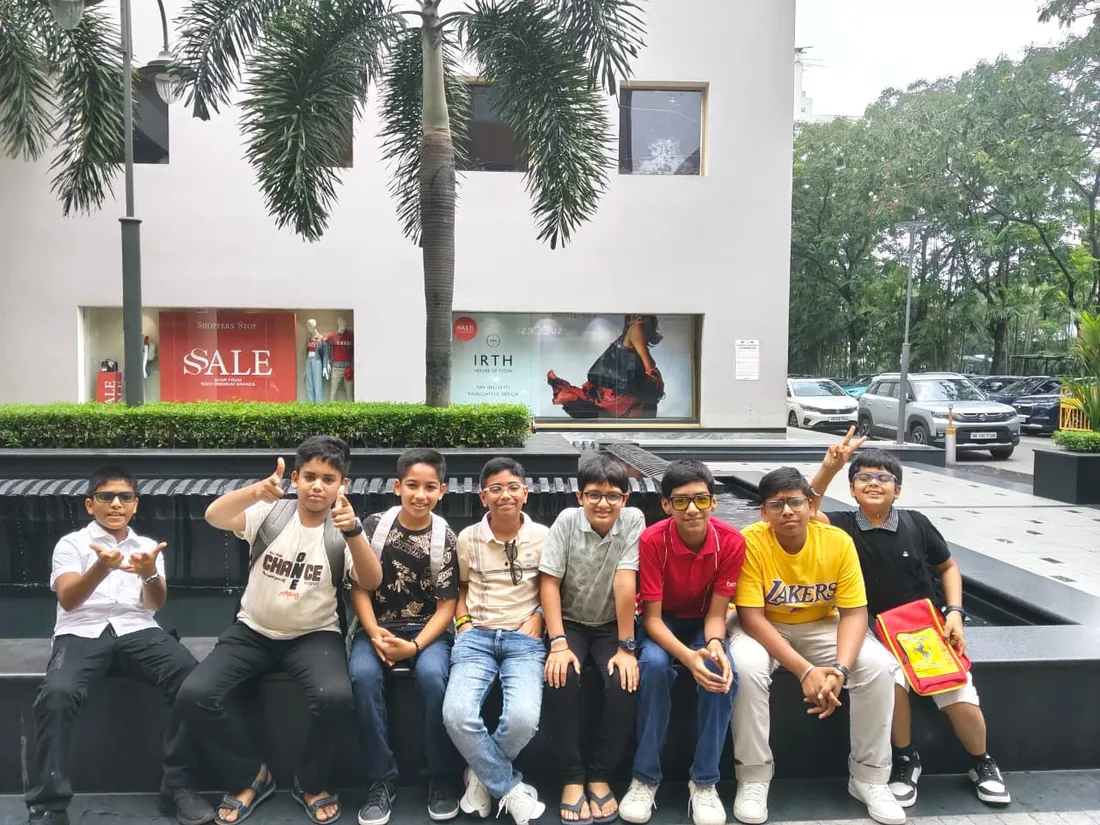
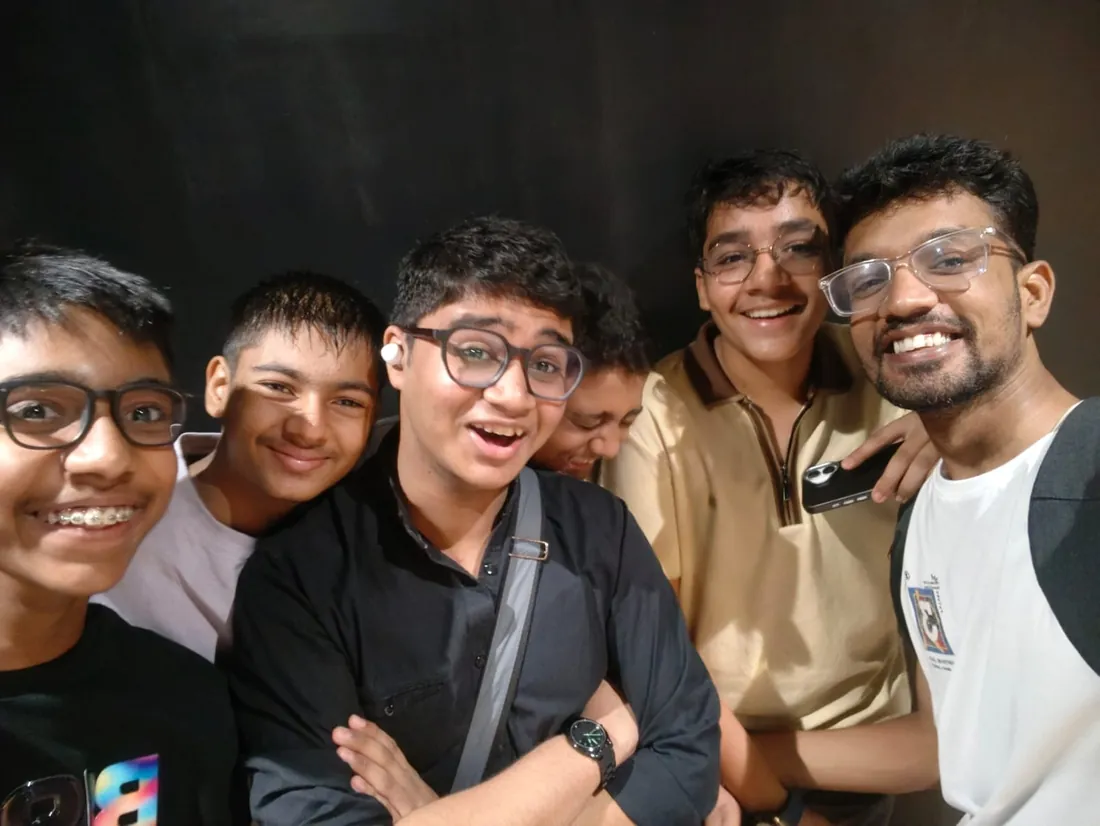
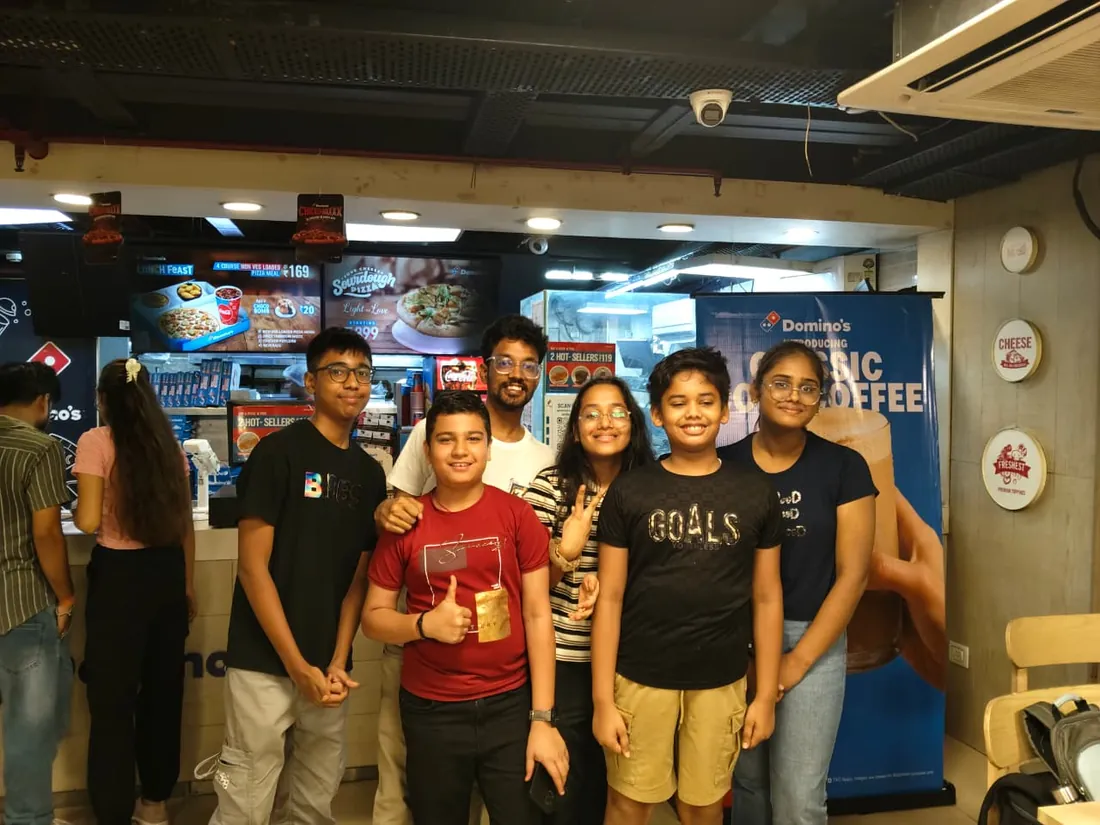
Real students. Real moments. Real joy.
These are our actual student meetups. No stock photos, no filters. Swipe through and meet the community you'll be joining.






























What families say
Straight from the parents and students who learn with us. Rated 4.9 across 547 Google reviews.
“Mivaan enjoys the class. He understands the concepts and completes his tasks with excitement. He started taking interest in coding… truly amazing class.”
“I absolutely love it here! I made new friends and learned important valuable coding skills while having the fun of my life. It's not just coding here, it's outings, bonding and most importantly preparing you for your future. Definitely five stars.”
“What stands out most is how excited my son is before every class. He looks forward to learning, problem-solving, and sharing what he's built. I've noticed a big boost in his confidence!”
“Modern Age Coders has been a game-changer for me! I struggled to grasp IT concepts and coding before joining, but their classes transformed everything. I'm now the topper in my class and can confidently write complex programs with ease.”
“Modern Age Coder have wonderful teachers who teach in a clear, easy and practical way. The teacher boosts students' confidence, keeps them updated with technology, and inspires them to learn without hesitation.”
“The one step solution for my son. Modern Age Coders make learning coding so simple that kids love it.”
“Coding classes here make learning very interesting and conceptual. The teachers teach us in a very easy-to-understand and efficient manner.”
“One of the most wonderful education centres out there. Education is not limited to school syllabus but focuses on skill development. Learning here has been a wonderful journey and still continuing.”
“I highly recommend this computer coding class! The teachers are incredibly knowledgeable and passionate about coding. They make every session engaging and insightful.”
“My child Dhairya is really enjoying the Modern Age Coder IT classes. This is his first online class, and he eagerly looks forward to it.”
“Very good classes. Don't worry about coding. They teach the best, especially Shivam sir.”
“Very good classes. Makes learning very easy and interactive.”
Hear it from our students
Real parents and students in their own words, on our public YouTube channel.
Straight answers about Data Science for Teens: Python & Your First ML Models
- Who should take this course?
- Ages 14 to 18, basic Python required. Age: 14 to 18, matched to the reasoning and statistics content. It suits teens who finished a first python course and want to apply it to something real rather than more syntax; students who argue from evidence and want the tools to find it themselves; teens heading toward engineering, economics, or science degrees where this exact stack appears in year one.
- What will they learn and build?
- Data science is the rare school-age subject where the professional tools are free and the real material, actual datasets about movies, sport, cities, and climate, is sitting in public archives waiting to be questioned.
- How deeply are topics covered?
- The course runs 6 months (24 weeks) at 2 live classes/week + 2-3 hours practice, across 3 phases listed week by week in the syllabus below. A structured, well-paced curriculum taught step by step, with hands-on practice in every session.
- Who teaches it?
- Modern Age Coders mentors, who teach the live classes themselves. You can watch them at work in the free class recordings before you decide.
- How do practice, feedback and assessment work?
- Classwork every session, a task after every class, monthly reviews that mix in earlier topics, and a final exam covering the whole course that decides the certificate: real knowledge and real work, with a free retest after revision if needed. Doubt support between classes over WhatsApp, so you are never left stuck. A certificate you earn by passing the final assessment, with a free retest after revision if needed.
- What does it cost?
- Three monthly plans: a group batch, a mini batch and 1-on-1. Prices are shown in your currency in the plans section. Monthly billing, cancel any time.
- When can classes take place?
- Live classes are scheduled around your week. Group batches meet at a fixed weekly slot; 1-on-1 students choose their own. International students are scheduled in their own timezone. Ask on WhatsApp for the current slots.
- Can I watch the teaching before deciding?
- Yes. Full recordings of real 13 and up classes are free to watch, free with a Google sign-in. These recordings show how we teach, not the exact syllabus of this course. Some classes are in English and some in Hindi; everyone follows at their own pace. Watch a class end to end, like you are in it. Sessions are interactive and each moment builds on the last.
- Can I enroll without a live demo?
- Yes. Choose a plan on this page and enrol directly; a demo is not required. If you would like to see a full class with a mentor first, book a Priority Demo.
- How do I reach you with a question?
- WhatsApp +91 91233 66161, email connect@modernagecoders.com, or call +91 91233 66161. Tell us the student's age and what they have learned so far, and we will point you to the right plan and batch.
Common Questions About Data Science for Teens: Python & Your First ML Models
Get answers to the most common questions about this comprehensive program
Still have questions? We're here to help!
Contact UsRelated Courses You May Like
Continue your learning journey with these recommended programs
 Data Science
Data Analysis Course: Excel, SQL, Python & BI
Data analysis course for college students and professionals: Excel mastery, statistics and SQL, then...
Explore Course Data Science
Trading Automation Course: Bots, Backtesting & Systems
Trading automation course for adults and professionals: build, backtest and deploy automated trading...
Explore CourseRelated Articles & Guides
Deepen your knowledge with these hand-picked articles
 Technology
26 min read
Technology
26 min read
Best Data Science Courses in India for Students and Professionals in 2026
Comprehensive guide to the best data science courses in India for 2026. Compare IITs, IIMs, online p...
Read Article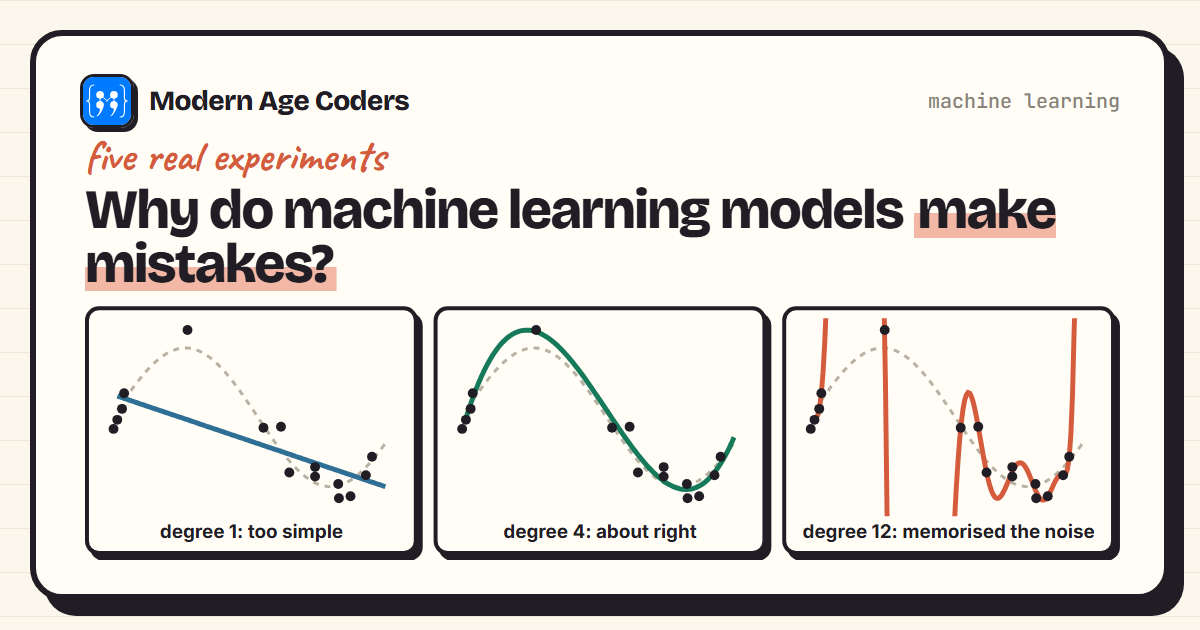 Artificial Intelligence
8 min read
Artificial Intelligence
8 min read
Why Do AI Models Make Mistakes? 5 Reasons, Tested
Why machine learning models make mistakes: overfitting, too little data, misleading accuracy, new si...
Read ArticleReady to start Data Science for Teens: Python & Your First ML Models?
Book a Priority Demo to see a full live class with a mentor reserved for you, today or tomorrow. Or choose a plan and enrol now.
Questions? WhatsApp +91 91233 66161 or email connect@modernagecoders.com