DSAU / ST / 01
Data Science for Teens
Ages 14 to 18, basic Python.
Open the syllabusAustralia · Ages 14 to adult · Question, clean, summarise, model
Data science is the craft of turning a messy table into an answer you can defend. Before any model, it means choosing the right data, cleaning it, and summarising it in a way that does not mislead, which is harder than it sounds. Our data science course teaches Australians from 14 to adulthood to do all of that in Python, live online, using real public data from Australian agencies. This page sets out the approach, works through one example on the latest council population figures from the Australian Bureau of Statistics, and shows where the same skills appear in the Australian Curriculum and in the national occupation classification.
Live teaching since 2020 · 10,000+ students · Real Australian data in every unit
In short
A data science course teaches how to collect, clean, summarise, visualise and model data to answer real questions, usually in Python. ANZSCO describes a data scientist as someone who applies analytical techniques and scientific procedures to large datasets. Modern Age Coders teaches data science live online to Australian teens from 14 and adults, with ABS and other public data, in small groups or one to one, and the first class is free.
Start here
Picked by age and experience. Each card opens the syllabus.
DSAU / 01
Ages 14 to 18 with basic Python: real data, statistics and first models.
Open the syllabus →
DSAU / 02
For 18 and over: Python, machine learning and deep learning from the beginning.
Open the syllabus →
DSAU / 03
The maths underneath: distributions, averages and testing ideas against data.
Open the syllabus →The cycle
Beginners rush to the model. Most of the work, and most of the mistakes, come earlier.
| Step | The question at this step | Typical trap |
|---|---|---|
| Ask | What exactly do we want to know, and for whom? | A question too vague to answer |
| Acquire | Where does trustworthy data come from, and what does each row mean? | Rows that are not what they seem, such as totals mixed with parts |
| Clean | What is missing, duplicated or wrongly coded? | Silently dropping awkward rows |
| Summarise and chart | What is typical, and what is unusual? | Reporting a mean for skewed data |
| Model and check | Does a model beat a simple baseline on new data? | Testing on the data used for training |
ANZSCO lists 224114 Data Analyst, who "Gathers, cleans and interprets data", and 224115 Data Scientist, who "Applies analytical techniques and scientific procedures to large datasets by creating advanced algorithms and data models".
The course covers the analyst's work first, because the scientist's work stands on it.
Australian agencies publish high-quality data under open licences. Learners can check every number they produce against the source, which is the habit we want.
Real data is also messier than textbook data, and that mess is the lesson.
A worked example
One question, asked of the ABS's 2025 estimated resident population for every local government area: how big is a typical Australian council?
We downloaded the 2025 figures from the ABS Data API. The file has 548 rows. Six are unincorporated areas, labelled as such in the ABS codelist, which are not councils, so a careful analyst sets them aside first and says so. That leaves 542 local government areas. Then come two different answers to "how big is a typical council?"
| Summary | Value | What it tells you |
|---|---|---|
| Mean (average) | 50,025 | Pulled up by a few very large councils |
| Median (middle council) | 13,306 | Half the councils are smaller than this |
| Councils above the mean | 134 of 542 | About one in four is above "average" |
| Largest council | Brisbane, 1,375,301 | Over 13,000 times the smallest |
| Smallest council | Maralinga Tjarutja, 102 | Its whole 2025 estimate |
Take Brisbane out and the mean falls from 50,025 to 47,575. The median barely moves, from 13,306 to 13,264.
Here the plain median describes a typical council far better than the mean. A 10% trimmed mean, 28,921, sits in between and is still well above most councils.
A histogram on a log scale shows why: most councils are small, with a long tail of big cities. Students draw it before writing any summary.
Choosing a summary is a decision, not a default. For skewed data such as populations, incomes or house sizes, the median usually tells the truth about the typical case, while the mean answers a different question: what each council would get if everyone were shared out equally.
Both are correct calculations. Only one fits the question asked.
Every number above comes from one Python script that reads the ABS file directly. Learners rerun it, then change one thing at a time and predict the result before running it again.
We do not add the councils up to compare with a national total, because published parts and published totals are produced separately.
Source, read 14 October 2026: ABS Data API, Estimated Resident Population by LGA, 2025, Creative Commons Attribution 4.0. Summaries are our own calculations.
At school
Students meet data handling in Digital Technologies well before senior school.
Content description AC9TDI8P01 asks students to "acquire, store and validate data from a range of sources using software, including spreadsheets and databases".
Our course moves the same work from spreadsheets into Python, so it can be repeated, checked and scaled.
By Year 10 the curriculum describes students visualising data "allowing greater exploration of trends and outliers to support or challenge their analyses".
The council example above is exactly that: an outlier challenging a summary.
Victorian senior students taking Data Analytics will find exam-specific help on our VCE Applied Computing: Data Analytics page. This course builds the general skills and never completes assessed work.
Sources, read 14 October 2026: ACARA, Digital Technologies curriculum content, Years 7 to 10; ABS, ANZSCO 2022 unit group 2241.
Projects
Each project uses public data and ends with a short written finding a non-specialist can follow.
| Project | Data | Main skill |
|---|---|---|
| Typical council | ABS population by local government area | Mean, median and skew |
| Weather extremes | Public daily weather observations | Cleaning gaps and spotting outliers |
| School holiday calendar | State education department term dates | Dates, joins and tidy tables |
| Commuter patterns | Public transport usage files | Grouping, time series and charts |
| First model | A labelled public dataset | Train, test and beat a baseline |
Learners drawn to the modelling end can continue with AI and machine learning classes. Those who want stronger programming habits first can take the software development course.
Charts
A chart is an argument. Learners pick the type by the question, then check that it cannot be misread.
| Question | Chart that fits | What to watch |
|---|---|---|
| How are values spread out? | Histogram, often on a log scale for populations | Bin widths that hide the shape |
| How do groups compare? | Bar chart starting at zero | Truncated axes that exaggerate gaps |
| How does something change over time? | Line chart | Missing periods drawn as if continuous |
| Are two measures related? | Scatter plot | Reading a pattern as cause and effect |
| What share does each part make? | A sorted bar chart rather than many pie slices | Parts that do not add up to the whole |
Drawn on an ordinary axis, the council populations look like one tall bar and hundreds of invisible ones. On a log scale the shape appears, and the gap between mean and median makes sense at a glance.
Learners draw both and write one sentence on what each would lead a reader to believe.
Every chart in the course has a title that states the finding, a labelled source and a date.
If the caption cannot be written in one sentence, the chart is not finished.
Using data responsibly
Much useful data describes people. Learners practise handling it responsibly from the first project.
Course datasets are chosen from aggregate public data, such as counts for a council or a month, so no individual can be identified.
Learners discuss why agencies adjust small counts and why those adjustments mean parts are not added up to match a published total.
A finding is only as good as the data behind it. Each written result ends with one sentence on what the data does not cover.
That habit protects readers from conclusions the numbers cannot support.
Students who want to see how data skills connect to AI can read learn to train AI, not just prompt it.
Progress
Progress is measured by what a learner can do with a fresh dataset, not by time served.
| Level | What you can do |
|---|---|
| 1. Reader | Load a public dataset and explain what each row and column means |
| 2. Cleaner | Find and fix missing, duplicated and miscoded values, and record what you changed |
| 3. Analyst | Choose summaries and charts that fit the data and the question |
| 4. Modeller | Train a model, test it on new data, and compare it with a simple baseline |
School maths is enough to begin. Averages, percentages and graphs come first; the statistics behind models is taught as it is needed.
Learners who want more depth can add our statistics course.
We make no job or salary promises. The course builds real, checkable projects and the judgement behind them.
Those projects are what a learner can show and talk through.
The catalogue
Grouped by stage. The free class decides where a learner starts.
DSAU / ST / 01
Ages 14 to 18, basic Python.
Open the syllabusDSAU / ST / 02
Excel, SQL, Python and BI, 18+.
Open the syllabusDSAU / ST / 03
Spreadsheets to dashboards.
Open the syllabusDSAU / MA / 01
From data to hypothesis tests.
Open the syllabusDSAU / MA / 02
Statistics, linear algebra, ML.
Open the syllabusDSAU / MA / 03
Querying data at scale, 18+.
Open the syllabusDSAU / ML / 01
Python, ML and deep learning, 18+.
Open the syllabusDSAU / ML / 02
Models for 13 to 18.
Open the syllabusDSAU / ML / 03
Visual machine learning.
Open the syllabusHow lessons run
Teachers are based in India, and the Indian working day overlaps Australian afternoons and evenings. Times are agreed in your state's time and adjusted for daylight saving.
After school
For teens in term time.
Evening
For adults, by arrangement.
Weekend
Longer analysis sessions.
A real dataset loaded and one honest summary written.
Fifteen to twenty learners comparing answers to the same question.
For a particular dataset, job need or pace.
Every dataset is cited, with its licence and date.
Every result comes from a script the learner can rerun.
Teachers guide; learners write and explain the code.
Student work
Applications our students built and published. Browse more in the student labs.
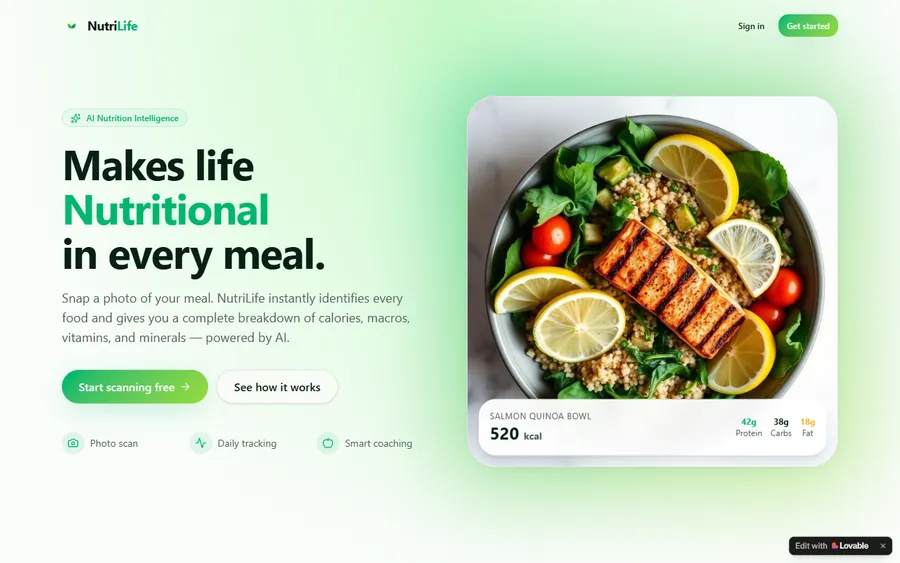
AI and ML
An AI nutrition coach that reads what you eat and works you toward a target.
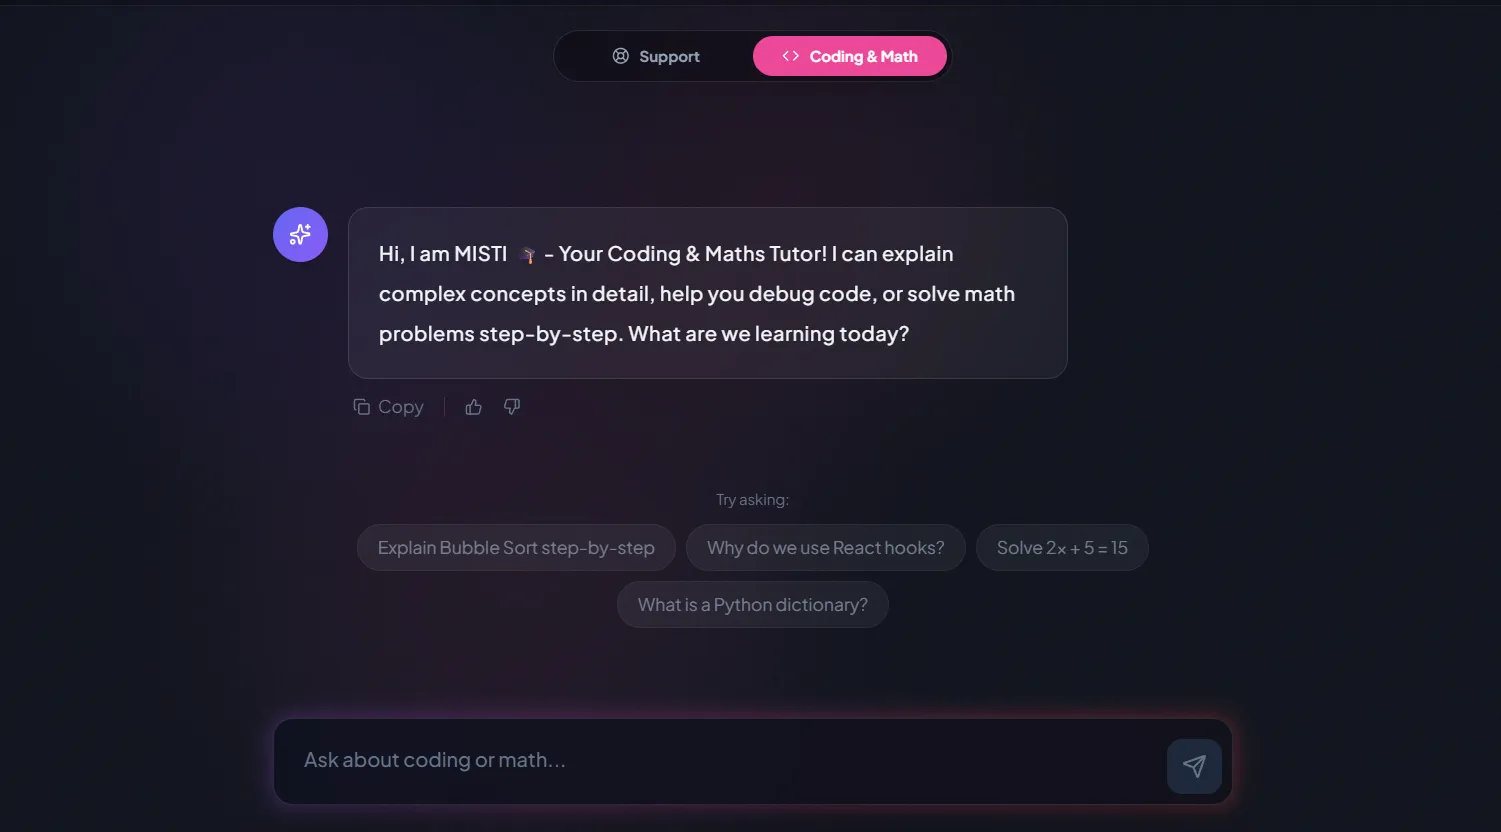
AI and ML
A chatbot that answers mathematics and programming questions, built and deployed by a student.
AI and ML
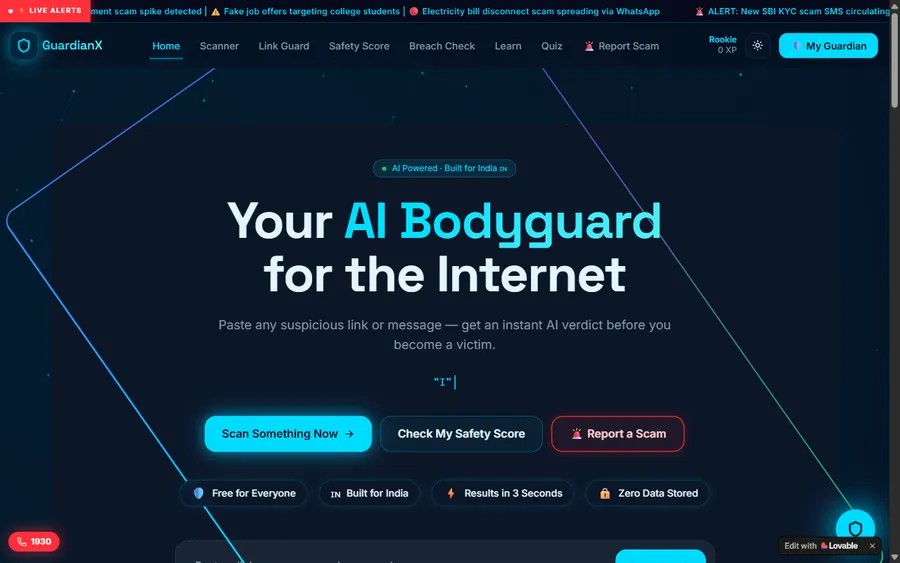
An assistant that helps a young person recognise unsafe situations online.
Web app
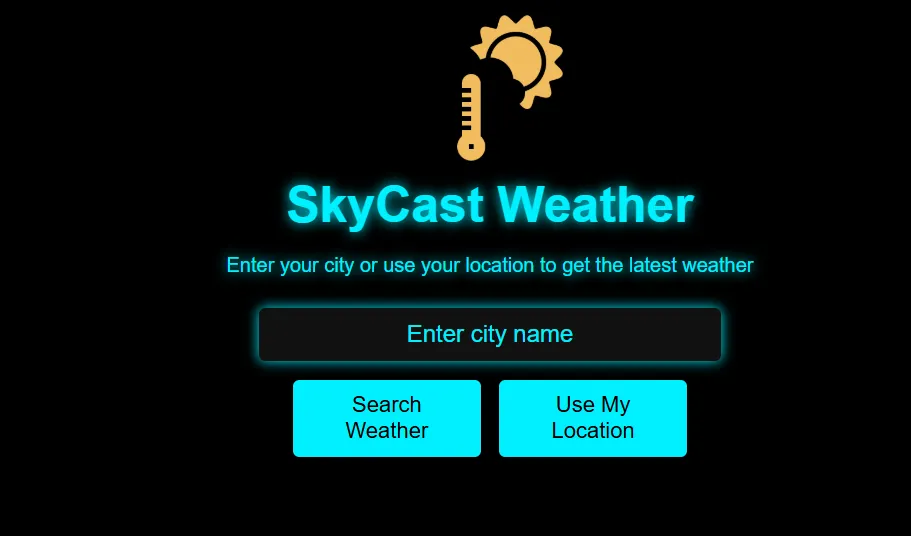
A weather forecasting site with live conditions for any location.
Fees
Learners outside India pay a monthly fee in US dollars. Nothing is due at sign-up and there is no contract.
Free first class
USD 0
no card required
Group batch
USD 100
a month, billed in US dollars
One to one
USD 150
a month, billed in US dollars
What families say
Published reviews from our Google profile, reproduced as written.
★★★★★
"The one step solution for my son. Modern Age Coders make learning coding so simple that kids love it. The teachers explain complex concepts clearly with practical exercises and interactive content."
Ria Mukherjee
Parent
★★★★★
"Modern Age Coders has been a game-changer for me. I struggled to grasp IT concepts and coding before joining, but their classes transformed everything. I can now confidently write complex programs with ease."
Samriddha Mondal
Student
★★★★★
"One of the most wonderful education centres out there. Education is not limited to school syllabus but focuses on skill development."
Vansh Agarwal
Student
★★★★★
"My child Dhairya is really enjoying the Modern Age Coders classes. This is his first online class and he eagerly looks forward to it. I can already see his improvement, and the teachers are very cooperative."
Sonam Oswal
Parent of Dhairya
★★★★★
"Modern Age Coders have wonderful teachers who teach in a clear, easy and practical way. The teacher boosts students' confidence and inspires them to learn without hesitation."
Sonu Goyal
Parent
★★★★★
"I highly recommend this computer coding class! The teachers are incredibly knowledgeable and passionate about coding."
Ritu Kedia
Parent
Learners ask
How to ask a clear question, find and clean data, summarise and chart it honestly, and build and test simple models, usually in Python.
The mean adds everything up and divides by the count; the median is the middle value. For Australian councils in 2025 the mean is 50,025 residents but the median is 13,306, because a few large councils pull the mean up.
Adults can start from zero in the adult course. The teen data science course expects basic Python, which our Python for Teens course provides.
Public Australian data such as ABS population figures, weather observations and transport usage, always cited with its licence.
ANZSCO 224115 Data Scientist applies analytical techniques and scientific procedures to large datasets by creating advanced algorithms and data models.
Data science covers the whole process from question to answer. Machine learning is one part of it, which our AI and machine learning classes cover in more depth.
It builds the general skills. Exam-specific help is on our VCE Data Analytics page, and we never complete assessed work.
From 14 with basic Python in the teen course, or 18 and over in the adult course.
We do not promise jobs or salaries. The course gives you checkable projects and the judgement to explain them.
No. The first lesson is free and needs no card. After that, a monthly fee applies, shown in the fees panel.
Also on this site
Pages that sit beside this one.
Where all our Australian pages start.
Models in more depth.
For Victorian senior students.
Testing, Git and debugging.
For adults switching fields.
Use, check and build AI.
Start here
Leave your details and we will call when it suits you. The first class loads a real dataset and ends with a recommendation.
Read about how our lessons work, or browse all courses.
WhatsApp us · +91 91233 66161 · connect@modernagecoders.com
The quickest reply comes through WhatsApp. Calls from Australia reach our India-based staff on the +91 number; we do not run an Australian office.
A priority demo is a full class of about 45 to 60 minutes. After the class the mentor sends a written skill report and a personal learning roadmap on WhatsApp. If you enrol, the demo fee is adjusted against your first month's fee. Share your demo Order ID with us on WhatsApp and we take it off.
Book a priority demo