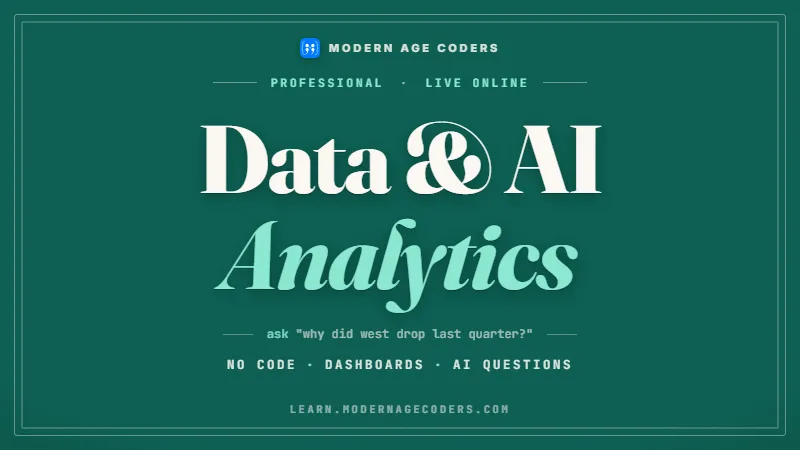
Data and AI Analytics for Non-Programmers
Become the person in the room who can actually answer the question with data, without writing a line of code.
Syllabus updated August 2026
Questions? WhatsApp +91 91233 66161 or email connect@modernagecoders.com
Recordings are free with a Google sign-in. These recordings show how we teach, not the exact syllabus of this course.
Fees and enrolment
How to join Data and AI Analytics for Non-Programmers (Excel, Sheets, Power BI)
Choose how you want to pay, pick a plan and press Enrol. We then fix your class timing with you.
Rated 4.9 across 547 Google reviews. Monthly billing, cancel any time.
How enrolment works
Pick a plan
Group (15 to 20 students), Mini Batch (up to 6, India only) or 1-on-1 with your own mentor. Billing is monthly.
Press Enrol and pay
Fill in the student's name, email and phone, then pay securely: UPI, cards or net banking in India, or a debit or credit card from any other country.
Fix your class timing
After paying, WhatsApp or call +91 91233 66161 with the student's name and your preferred time. We confirm the batch or 1-on-1 slot and send the class link.
Start learning
Join your first live class at the time you chose. Your mentor takes it from there.
Want to see a class first? Book a Priority Demo: a live class of about 45 to 60 minutes with a mentor reserved for you. If you enrol, the demo fee is adjusted against your first month's fee. Share your demo Order ID with us on WhatsApp and we take it off.
Billing is monthly and you can cancel any time.
International Students (Outside India)
Billed monthly in US dollars, the same price in every country. Contact us with any questions.
Questions before you enrol? Talk to our team.
Ask about class timings, the right level for your child, what they need to know already, or payment. Parents and adult learners can reach us on WhatsApp, by email or by phone.
Our promise
The world's best learning experience, open to everyone.
- World-class instructorsEvery class is taught by an instructor who specialises in that exact field.
- No compromise on qualityEvery lesson, project and piece of feedback is held to the highest standard.
- Education for everyoneLearners aged 6 to 67, from first-time beginners to working professionals, in 25+ countries.
If you want the highest quality, Modern Age Coders is the right choice.
Book a Priority DemoHow long this course takes
This course runs 4 months (16 weeks), joinable any month at 2 live classes/week + weekly work on real datasets. The range allows for background and pace: a complete beginner uses the full span, and a student with prior knowledge finishes sooner. The syllabus below is planned to the shorter end, with margin kept for revision.
For personalised duration planning, call +91 91233 66161 and we'll map a schedule to your goals.
At a glance
- Who it is for
- Working professionals and students with no programming background; spreadsheet familiarity helps but is not required.
- Prerequisites
- None. The course starts from the beginning.
- Format
- Live, interactive online classes with a real mentor, never pre-recorded videos. Live classes run about one hour.
- Language
- English or Hindi, depending on the batch.
- Duration
- 4 months (16 weeks), joinable any month
- Weekly commitment
- 2 live classes/week + weekly work on real datasets
- Class size
- Group batches of 15 to 20 students, mini batches of up to 6, or 1-on-1.
- Certificate
- Certificate from Modern Age Coders, awarded on passing the final assessment
- Watch first
- Free recordings of real classes for ages 13 and up, free with a Google sign-in. These recordings show how we teach, not the exact syllabus of this course.
- Live demo
- Optional. Enrol directly on this page, or book a Priority Demo: a full live class of about 45 to 60 minutes with a mentor reserved for you.
- Questions
- WhatsApp +91 91233 66161 or email connect@modernagecoders.com.
How we teach
Deep understanding. Real projects. Expert guidance.
Learn coding, AI and maths through careful explanations, practical demonstrations, and hands-on problem-solving. Our instructors guide you from the foundations to advanced ideas, helping you understand what happens, why it happens, and how to build it yourself.
You will explore concepts step by step, write and improve code, investigate mistakes, ask questions, and apply your knowledge to meaningful projects. Lessons are designed around active participation, thoughtful feedback, and growing independence.
Expert-led live teaching, with practical participation built into every lesson.
- Students explain their thinking.
- Instructors demonstrate, then guide practice.
- Learners code, solve, or build during lessons.
- Questions and misconceptions get attention.
- Assignments receive useful feedback.
- Progress is checked before advancing.
Program Overview
Most people who need to work with data are not going to become programmers, and they do not need to. The person who can take a messy export, clean it, find the real pattern and present it clearly in a dashboard is enormously valuable in any team, and almost none of that requires code. What it requires is knowing how to structure data, which comparison is honest, and how to build something a decision-maker can actually read.
This course teaches exactly that path, in the tools your workplace already has. You start with spreadsheets done properly, Excel and Google Sheets, including the lookup and pivot skills most people never learn. You move into cleaning and shaping real messy data, which is where most analysis actually fails. Then you build interactive dashboards in Power BI and learn to model relationships between tables so the numbers hold up under questioning.
AI runs through the whole course, honestly. Modern AI assistants can write your formulas, summarise a dataset and suggest a chart, and used well they make you considerably faster. Used badly they produce confident nonsense that you then present to your manager. So we teach both: how to use AI to accelerate the work, and how to check what it gives you before you trust it. Every module ends with real, messy datasets rather than tidy teaching examples, because tidy data is not what anybody actually receives.
What Makes This Program Different
- No coding required at any point, and no pretending you will secretly need Python later
- Built on the tools your workplace already has: Excel, Google Sheets and Power BI
- Real messy data from week one, because cleaning is where most analysis actually fails
- AI assistants taught honestly: how to go faster with them, and how to catch the confident nonsense before you present it
- Focused on the question behind the request, since the hard part is usually deciding what to measure
- Live, small batches where your dashboard gets critiqued like a colleague would critique it
Your Learning Journey
Career Progression
Detailed Course Curriculum
Explore the complete week-by-week breakdown of what you'll learn in this comprehensive program.
Topics Covered
- What a clean table actually looks like, and why yours probably is not one
- Rows as records, columns as fields, and one fact per cell
- Why merged cells and colour-as-data destroy analysis
- Data types, dates and the formatting traps that silently break totals
- Turning a human-formatted sheet into an analysable one
Projects You Build
- Take a genuinely badly structured sheet and restructure it into a usable table
Practice & Assignments
Restructure three messy real-world sheets
Topics Covered
- Absolute and relative references, and why formulas break when copied
- IF, nested conditions, and when to stop nesting
- SUMIF, COUNTIF, AVERAGEIF and their multi-criteria versions
- Text and date functions for real cleanup
- Error handling so a broken cell does not poison a whole column
Projects You Build
- Build a summary sheet driven entirely by formulas from a raw data tab
Practice & Assignments
20 formula tasks against a real dataset
Topics Covered
- VLOOKUP, XLOOKUP and INDEX with MATCH, and when each is right
- Joining two tables on a common key
- Handling missing matches honestly instead of hiding them
- Duplicate keys and the quiet damage they do
- The equivalents in Google Sheets
Projects You Build
- Combine three separate exports into one analysable table and reconcile the mismatches
Practice & Assignments
15 lookup and join exercises including deliberately broken keys
Assessment
A timed spreadsheet task: clean, join and summarise a real dataset
Topics Covered
- Pivot tables from the ground up
- Grouping, filtering and calculated fields
- Slicing by dimension to find where a number actually comes from
- Reading a pivot critically instead of accepting it
- Charts that clarify rather than decorate
Projects You Build
- Answer five real business questions about one dataset using only pivots
Practice & Assignments
Build pivots answering supplied questions, then explain each finding
Topics Covered
- Duplicates, near-duplicates and how to decide which is real
- Missing values and the options: exclude, impute or report
- Inconsistent categories and text normalisation
- Outliers, and telling a data error from a genuine extreme
- Documenting every cleaning decision so your numbers are defensible
Projects You Build
- Clean a genuinely messy dataset and write a short log of every decision made
Practice & Assignments
Clean three datasets with different problems
Topics Covered
- Why manual cleaning does not survive next month's file
- Power Query basics: importing, transforming and loading
- Building a repeatable cleaning pipeline
- Unpivoting and reshaping data
- Refreshing when new data arrives, with no rework
Projects You Build
- Build a Power Query pipeline that cleans a monthly export automatically
Practice & Assignments
Convert last week's manual cleaning into a repeatable query
Topics Covered
- Mean, median and when the average actively misleads
- Spread and why two datasets with the same average differ completely
- Percentages, percentage points and the errors that get presented in meetings
- Correlation is not causation, with real examples
- Sample size and why small numbers should not drive big decisions
Projects You Build
- Take a real claim from a report and check whether the data actually supports it
Practice & Assignments
Critique supplied analyses and identify what each gets wrong
Assessment
A written critique of a deliberately misleading analysis
Topics Covered
- Choosing the chart from the question, not from preference
- Truncated axes and the other ways charts mislead
- Comparing like with like
- Labelling so a chart survives being forwarded without you
- Removing everything that is not carrying information
Projects You Build
- Redesign three bad charts and explain what each change fixes
Practice & Assignments
Build charts for supplied questions and defend each choice
Topics Covered
- Connecting to data and shaping it on import
- The difference between a report and a dashboard
- Core visuals and when each is appropriate
- Filters, slicers and cross-filtering
- Publishing and sharing safely
Projects You Build
- Build your first working Power BI report from a real dataset
Practice & Assignments
Rebuild an existing spreadsheet report as a Power BI report
Topics Covered
- Fact and dimension tables in plain language
- Relationships and why a star schema keeps numbers correct
- The problems caused by one flat table
- Date tables and time intelligence
- Diagnosing a wrong total caused by a bad relationship
Projects You Build
- Model a multi-table dataset properly and prove the totals reconcile
Practice & Assignments
Fix three broken data models
Topics Covered
- Calculated columns versus measures, and why the difference matters
- Core DAX: SUM, AVERAGE, COUNTROWS, CALCULATE
- Filter context in plain terms
- Time comparisons: month on month, year on year
- Writing measures you can still understand next quarter
Projects You Build
- Add a full measure set to your model including period comparisons
Practice & Assignments
15 DAX exercises building from simple to filtered
Assessment
A timed dashboard task assessed on correctness and clarity
Topics Covered
- Starting from the decision the dashboard should support
- Layout, hierarchy and what belongs above the fold
- Restraint: fewer visuals, better chosen
- Making it self-explanatory without you presenting it
- Testing it on someone who has never seen it
Projects You Build
- Redesign your dashboard after watching someone else try to use it
Practice & Assignments
Peer usability reviews of each other's dashboards
Topics Covered
- What AI assistants are genuinely good at in analytics work
- Getting formulas, DAX and cleaning steps written for you
- Asking for an explanation of a formula you inherited
- Writing a prompt that includes the context the model needs
- Speed gains that are real, and the ones that are illusory
Projects You Build
- Solve a full analysis task using AI assistance and log where it helped and where it did not
Practice & Assignments
Complete supplied tasks with AI, then verify every output
Topics Covered
- Why an AI can produce a confident, plausible, wrong formula
- Verifying a result against a known subtotal before trusting it
- Spot-checking summaries against the raw data
- Never pasting confidential data into a tool that is not approved
- Being able to explain any number you present, whatever produced it
Projects You Build
- Audit a set of AI-produced analyses and find the errors deliberately planted in them
Practice & Assignments
Verification drills on AI output
Assessment
A verification test: find every error in an AI-assisted analysis
Topics Covered
- Choosing a question that matters to a real audience
- Sourcing and cleaning the data end to end
- Modelling, measures and dashboard build
- Documenting assumptions and limitations honestly
- Preparing to defend every number
Projects You Build
- Build your full capstone: question, clean data, model, dashboard, findings
Practice & Assignments
Capstone checkpoints with review
Topics Covered
- Leading with the finding, not the method
- Telling the story a decision-maker needs in two minutes
- Answering the hard question about your data honestly
- Packaging the project for a portfolio or interview
- What to say when the data does not support the hoped-for answer
Projects You Build
- Present your capstone and take questions from the group
Practice & Assignments
Rehearsed presentations with critique
Assessment
Final capstone presentation assessed on clarity, correctness and honesty
Projects You'll Build
Build a professional portfolio with 50+ projects real-world projects.
Weekly Learning Structure
Certification & Recognition
Technologies & Skills You'll Master
Comprehensive coverage of the entire modern web development stack.
Career Outcomes & Opportunities
Transform your career with industry-ready skills and job placement support.
Prerequisites
Who Is This Course For?
Career Paths After Completion
Course Guarantees
Real students. Real moments. Real joy.
These are our actual student meetups. No stock photos, no filters. Swipe through and meet the community you'll be joining.







































What families say
Straight from the parents and students who learn with us. Rated 4.9 across 547 Google reviews.
“Mivaan enjoys the class. He understands the concepts and completes his tasks with excitement. He started taking interest in coding… truly amazing class.”
“I absolutely love it here! I made new friends and learned important valuable coding skills while having the fun of my life. It's not just coding here, it's outings, bonding and most importantly preparing you for your future. Definitely five stars.”
“What stands out most is how excited my son is before every class. He looks forward to learning, problem-solving, and sharing what he's built. I've noticed a big boost in his confidence!”
“Modern Age Coders has been a game-changer for me! I struggled to grasp IT concepts and coding before joining, but their classes transformed everything. I'm now the topper in my class and can confidently write complex programs with ease.”
“Modern Age Coder have wonderful teachers who teach in a clear, easy and practical way. The teacher boosts students' confidence, keeps them updated with technology, and inspires them to learn without hesitation.”
“The one step solution for my son. Modern Age Coders make learning coding so simple that kids love it.”
“Coding classes here make learning very interesting and conceptual. The teachers teach us in a very easy-to-understand and efficient manner.”
“One of the most wonderful education centres out there. Education is not limited to school syllabus but focuses on skill development. Learning here has been a wonderful journey and still continuing.”
“I highly recommend this computer coding class! The teachers are incredibly knowledgeable and passionate about coding. They make every session engaging and insightful.”
“My child Dhairya is really enjoying the Modern Age Coder IT classes. This is his first online class, and he eagerly looks forward to it.”
“Very good classes. Don't worry about coding. They teach the best, especially Shivam sir.”
“Very good classes. Makes learning very easy and interactive.”
Hear it from our students
Real parents and students in their own words, on our public YouTube channel.
Straight answers about Data and AI Analytics for Non-Programmers (Excel, Sheets, Power BI)
- Who should take this course?
- Working professionals and students with no programming background; spreadsheet familiarity helps but is not required.
- What will they learn and build?
- Most people who need to work with data are not going to become programmers, and they do not need to. The person who can take a messy export, clean it, find the real pattern and present it clearly in a dashboard is enormously valuable in any team, and almost none of that requires code.
- How deeply are topics covered?
- The course runs 4 months (16 weeks), joinable any month at 2 live classes/week + weekly work on real datasets, across 3 phases listed week by week in the syllabus below.
- Who teaches it?
- Modern Age Coders mentors, who teach the live classes themselves. You can watch them at work in the free class recordings before you decide.
- How do practice, feedback and assessment work?
- Classwork in every session and homework after every class. Classwork every session, a task after every class, monthly reviews that mix in earlier topics, and a final project defended live, plus a written assessment that decides the certificate: real knowledge and real work, with a free retest after revision if needed. A certificate you earn by passing the final assessment, with a free retest after revision if needed.
- What does it cost?
- Three monthly plans: a group batch, a mini batch and 1-on-1. Prices are shown in your currency in the plans section. Monthly billing, cancel any time.
- When can classes take place?
- Live classes are scheduled around your week. Group batches meet at a fixed weekly slot; 1-on-1 students choose their own. International students are scheduled in their own timezone. Ask on WhatsApp for the current slots.
- Can I watch the teaching before deciding?
- Yes. Full recordings of real 13 and up classes are free to watch, free with a Google sign-in. These recordings show how we teach, not the exact syllabus of this course. Some classes are in English and some in Hindi; everyone follows at their own pace. Watch a class end to end, like you are in it. Sessions are interactive and each moment builds on the last.
- Can I enroll without a live demo?
- Yes. Choose a plan on this page and enrol directly; a demo is not required. If you would like to see a full class with a mentor first, book a Priority Demo.
- How do I reach you with a question?
- WhatsApp +91 91233 66161, email connect@modernagecoders.com, or call +91 91233 66161. Tell us the student's age and what they have learned so far, and we will point you to the right plan and batch.
Common Questions About Data and AI Analytics for Non-Programmers (Excel, Sheets, Power BI)
Get answers to the most common questions about this comprehensive program
Still have questions? We're here to help!
Contact UsRelated Courses You May Like
Continue your learning journey with these recommended programs
 Kids Coding
Python and AI for Kids: Games, Turtle Art and Smart Projects
Python course for kids aged 9-12: live online classes from first code to turtle art, Pygame games an...
Explore Course GCSE Computer Science
GCSE Computer Science: AQA, OCR and Edexcel Exam Prep
Live online GCSE Computer Science classes taught to your child's actual board. AQA 8525, OCR J277 an...
Explore CourseRelated Articles & Guides
Deepen your knowledge with these hand-picked articles
 Business
10 min read
Business
10 min read
How Data Analytics and Math Help Businesses Make Better Decisions
Discover how data analytics transforms business decisions. Real examples, practical tools, implement...
Read Article Career
28 min read
Career
28 min read
Data Science, AI, and Math: Skills Every Tech Professional Must Learn
Master data science, AI, and math skills for 2025. Complete guide with skill assessments, learning p...
Read ArticleReady to start Data and AI Analytics for Non-Programmers (Excel, Sheets, Power BI)?
Book a Priority Demo to see a full live class with a mentor reserved for you, today or tomorrow. Or choose a plan and enrol now.
Questions? WhatsApp +91 91233 66161 or email connect@modernagecoders.com