UK / ST1 / 01
Statistics and Probability
Every stage of the enquiry cycle, at either tier.
Open the syllabusEngland · GCSE Statistics · AQA 8382 and Pearson Edexcel 1ST0
GCSE Statistics is often the GCSE nobody planned for. It is offered as a second maths qualification, sometimes in an options block and sometimes after school, and it is usually taught in fewer hours than GCSE Maths. Students who take it meet ideas that GCSE Maths barely touches, such as Spearman's rank correlation, index numbers, moving averages and capture and recapture, all tied together by a five-stage statistical enquiry cycle that both boards place at the centre. This page compares AQA 8382 and Pearson Edexcel 1ST0 from their own specifications, gives the June 2027 dates, explains the enquiry cycle and the calculator rules, and works three original Higher-level problems.
Live teaching since 2020 · 10,000+ students · Built from the AQA 8382 and Pearson 1ST0 specifications
In short
GCSE Statistics is a separate GCSE from GCSE Maths, offered in England by AQA (specification 8382) and Pearson Edexcel (1ST0). Each has a Foundation tier (grades 1 to 5) and a Higher tier (grades 4 to 9) and two 80-mark written papers; AQA papers last 1 hour 45 minutes and Edexcel papers 1 hour 30 minutes. In June 2027 both boards sit Paper 1 on 7 June and Paper 2 on 16 June. Modern Age Coders teaches GCSE Statistics live online through its Statistics and Probability course, 1-on-1 or in a group of 15 to 20. We are independent of both boards.
Start here
The first is the course built for this GCSE. The second suits a student taking Statistics alongside GCSE Maths; the third is for a student who wants to work with real data sets in code.
ST / 01
The 8382 or 1ST0 content in enquiry-cycle order, with each board's papers.
Open the syllabus →
ST / 02
For the GCSE that most Statistics students sit in the same summer.
Open the syllabus →
ST / 03
Real data, cleaned and charted in Python: the processing stage of the cycle done by machine.
Open the syllabus →AQA and Edexcel
Less than for GCSE Maths. Ofqual sets the same assessment objectives for both, and both sit in June only. The main differences are paper length, calculator expectations and how the content is laid out.
| Feature | AQA 8382 | Pearson Edexcel 1ST0 |
|---|---|---|
| Specification read | Version 1.2, June 2026 | Issue 2, December 2017 |
| Papers | Two, same tier, same series | Two, same tier, same series |
| Length of each paper | 1 hour 45 minutes | 1 hour 30 minutes |
| Marks per paper | 80 | 80 |
| Tiers | Foundation 1 to 5; Higher 4 to 9, allowed grade 3 | Foundation 1 to 5; Higher 4 to 9 |
| Exam series | Every May/June | May/June only |
| June 2027, Paper 1 | Monday 7 June, afternoon | Monday 7 June, afternoon |
| June 2027, Paper 2 | Wednesday 16 June, morning | Wednesday 16 June, morning |
| Qualification number | 603/1177/0 | 603/1084/4 |
The two boards sit on the same afternoon and morning in June 2027, because the GCSE timetable is shared across boards. AQA's papers are fifteen minutes longer for the same 80 marks, which gives a little more time per mark; AQA describes its question styles as "Multiple choice, short answer and a Statistical Enquiry Cycle (SEC) question", while Pearson describes "short response, medium response and extended response questions". AQA's specification also states plainly that "A student sitting the Higher tier who just fails to achieve grade 4 will be awarded an allowed grade 3."
| Objective | What it asks | Weighting |
|---|---|---|
| AO1 | Knowledge and understanding of standard techniques to collect and represent data, and to calculate summary statistics and probabilities | 55% |
| AO2 | Interpret statistical information in context and reason statistically to draw conclusions | 25% |
| AO3 | Assess the appropriateness of methods and conclusions through the statistical enquiry cycle | 20% |
AQA explains why the table is the same for both: "Assessment objectives (AOs) are set by Ofqual and are the same across all GCSE Statistics specifications and all exam boards." Pearson splits each objective evenly across its papers, printing 27.5% AO1, 12.5% AO2 and 10% AO3 for each one. Compared with GCSE Maths, technique (AO1) carries more weight, but a fifth of the marks still go to judging whether a method or a conclusion is sound, which is where students who only drill calculations lose ground.
Sources: AQA GCSE Statistics 8382 specification (version 1.2, June 2026) and 8382 key dates; Pearson Edexcel GCSE Statistics 1ST0 specification (Issue 2) and the Pearson Summer 2027 final timetable. All read on 31 October 2026.
The enquiry cycle
It is the five-stage process both boards build the course on, from asking a question to reviewing the answer. AQA says it "underpins the study of Statistics", and both boards set exam questions on its stages.
AQA lists the five stages as "initial planning", "data collection", "data processing and presentation", "interpretation of results" and "evaluation and review". Pearson goes further in how it lays out the content: "The order of the content, for each tier, follows the order of the statistical enquiry cycle." Every topic, from sampling to Spearman's rank, belongs to one of the stages, and a typical extended question walks through several of them.
| Stage | From the AQA specification | Our question to ask at that stage |
|---|---|---|
| 1. Initial planning | Defining a question or hypothesis; deciding what data to collect and how | Is the hypothesis testable, and what would count as evidence against it? |
| 2. Data collection | Constraints on primary and secondary data; acknowledging sources | Who is missing from this sample, and why? |
| 3. Processing and presentation | Organising data, diagrams, summary measures, the role of technology | Does this diagram suit this kind of data? |
| 4. Interpretation | Conclusions that relate to the question; inferences; reliability | Does the conclusion answer the original question, in context? |
| 5. Evaluation and review | Weaknesses in approach; improvements; refining the hypothesis | What one change would make the result more trustworthy? |
The cycle is why GCSE Statistics feels different from the statistics strand of GCSE Maths. In Maths, a question usually hands over the data and asks for a mean or a box plot. In Statistics, a question may ask why a sample of shoppers outside one shop at 9 am is a poor sample, what a hypothesis should be, or whether a conclusion follows from the diagram. Those are AO3 marks, and they reward a student who has carried out an enquiry, not just read about one. AQA says as much: "Practical experience of the cycle is integral to their understanding of the principles of the SEC."
AQA's specification includes topics a Maths student will not meet: Spearman's rank correlation, weighted index numbers, moving averages for time series, Petersen capture and recapture, binomial situations and quality assurance sampling.
Pearson organises its content under three headings: "The collection of data", "Processing, representing and analysing data", and "Probability".
Pearson states "There is no formulae sheet for Foundation tier"; the one formula Foundation students may need, a rate of change such as a birth rate, is given in the question. Higher papers carry a formulae sheet on page 2 with skew, standard deviation and Spearman's rank.
AQA's notes say that formulae for skewness, and for rates of change, "will be given" when needed.
Calculators
Yes, on every paper of both boards. The boards differ on one point: whether students are expected to use the calculator's statistics mode.
AQA sets a minimum: the calculator must have "four rules", "square", "square root", "reciprocal function", "power function", "brackets" and "a memory facility". It then adds that "Students may use the statistical functions on their calculator, where appropriate, if they wish but this is not a requirement of the specification." Pearson is firmer: students "are expected to be familiar with the statistical function keys on their scientific calculators."
Entering a list into statistics mode gives the mean and standard deviation at once. A Higher student who can do this saves minutes on a long data question.
Write the method line first, such as the sum of the d squared terms in Spearman's rank, then use the calculator. Method marks need the written step.
Store intermediate results, especially in standard deviation and Spearman's rank, so rounding happens once at the end.
In our classes we teach the statistics mode on the student's own calculator model in the first weeks, because the keys differ between models and a student should not discover that in the exam room. We teach the hand method too, since the papers reward seeing the structure of a calculation and not only its answer.
Worked examples
Original problems, not board questions, on three topics unique to GCSE Statistics. Each ends with the interpretation sentence that AO2 and AO3 marks depend on.
Question (ours). Volunteers catch and mark 40 newts in a pond and release them. A week later they catch 50 newts, of which 8 are marked. Estimate the number of newts in the pond, and state one assumption.
Method. The Petersen estimate is N = M × n ÷ m, where M is the number first marked, n the second catch and m the marked newts in it.
Working. N = 40 × 50 ÷ 8 = 250 newts.
Assumption. The population did not change between the two visits, and marked newts mixed back in and were as likely to be caught as unmarked ones. An answer without an assumption is unfinished.
Question (ours). Five students are ranked on a maths test and a statistics test: A (1, 2), B (2, 1), C (3, 4), D (4, 3), E (5, 5). Calculate Spearman's rank correlation coefficient and interpret it.
Differences. d = −1, 1, −1, 1, 0, so the sum of d² is 1 + 1 + 1 + 1 + 0 = 4.
Working. rs = 1 − (6 × 4) ÷ (5 × (25 − 1)) = 1 − 24 ÷ 120 = 0.8.
Interpretation. Strong positive correlation between the rankings: students who ranked high in one test tended to rank high in the other. With only five students, the result is weak evidence; a larger sample would be more reliable.
Question (ours). A student wants to know how far pupils at her school travel to school. She asks the first 30 pupils who arrive at the front gate one morning. Give two reasons the sample may be biased and suggest a better method.
Reasons. Early arrivals may differ from the rest, for example pupils dropped off by car on the way to work. Pupils who arrive at another entrance, such as by school bus at the back, are left out entirely.
Better method. A stratified sample by year group, chosen at random from the school register, with the sample in each year proportional to its size.
Why it matters. This is a stage 2 question in the cycle. No calculation is needed, but a full answer names the bias and says why it distorts the result.
Each problem has a number in it, and each ends with a sentence about what the number means and how far it can be trusted.
That closing sentence is the habit we drill most in GCSE Statistics. Students who stop at 250 or 0.8 leave the interpretation marks behind.
Practice set (ours, answers at the end). (1) Quarterly sales are 12, 18, 15, 21 and 16; find the two 4-point moving averages. (2) An item cost 80 units in the base year and costs 92 now; find its index number. (3) A data set has lower quartile 14 and upper quartile 29; find the interquartile range. (4) A distribution has mean 52, median 49 and standard deviation 6; use skew = 3(mean − median) ÷ standard deviation and describe the skew. (5) Give one advantage of a pilot survey. Answers: (1) 16.5 and 17.5; (2) 115; (3) 15; (4) 1.5, positive skew; (5) it shows up unclear or leading questions before the full survey is run.
Fitting it in
AQA says its specification "is designed to be taken over two years", but many schools teach it in less time than that. Our plan shares the work with GCSE Maths where the two overlap and keeps separate time for what only Statistics covers.
This plan is ours. It assumes Statistics is the second maths GCSE and that GCSE Maths is the priority, which is usually the right order for a student's next step after 16. For a student already strong in maths and drawn to data, Statistics can be the more enjoyable of the two, and it leads naturally to A level Maths, whose statistics strand builds on it.
Progression
A student climbs a rung by doing it on a real 8382 or 1ST0 paper.
| Rung | When | What should be true |
|---|---|---|
| 1. Overlap secure | First term | Averages, spread and diagrams shared with GCSE Maths done without error |
| 2. Statistics-only topics | By the spring | Spearman's rank, index numbers, moving averages and capture and recapture carried out correctly |
| 3. One enquiry done | Before the last term | All five stages of the cycle carried through on real data |
| 4. Interpretation automatic | Before 7 June 2027 | Every numerical answer followed by a sentence in context |
Students who have run an enquiry answer stage questions from experience rather than memory.
Our AP Statistics page shows where this kind of thinking leads in the US system.
It is the habit that takes longest to become automatic, and it carries marks on almost every extended question.
We send families a short monthly progress note.
The catalogue
Grouped by role: the GCSE itself, the maths around it, and the data skills beyond it.
UK / ST1 / 01
Every stage of the enquiry cycle, at either tier.
Open the syllabusUK / ST1 / 02
The partner GCSE most Statistics students also sit.
Open the syllabusUK / ST1 / 03
For formulae such as Spearman's rank and skew.
Open the syllabusUK / ST2 / 01
Cleaning and charting real data in Python.
Open the syllabusUK / ST2 / 02
Visual data analysis without writing code.
Open the syllabusUK / ST2 / 03
Simulations of probability experiments.
Open the syllabusUK / ST3 / 01
The statistics strand continues here.
Open the syllabusUK / ST3 / 02
For students heading to American universities.
Open the syllabusUK / ST3 / 03
Statistics and linear algebra for older learners.
Open the syllabusHow lessons work
Weekdays or weekends, flexible: choose your batch, or for a very personalised plan choose 1-on-1 at your convenience, weekend mornings or weekdays. Teaching happens from India, with every class booked in UK time.
After school
Fits a second GCSE well.
Evenings
Around GCSE Maths homework.
Weekend mornings
Room for a full 1 hour 45 minute AQA paper.
AQA 8382 or Pearson 1ST0 papers and mark schemes, at the student's tier.
Every topic placed in one of the five stages of the enquiry cycle.
Statistics functions on the student's own calculator model.
One small investigation on real data, carried from question to review.
One live class before any payment, to agree where to begin.
A batch of 15 to 20 Statistics students, or lessons for one.

AI and ML
An AI nutrition coach that reads what you eat and works you toward a target.
AI and ML
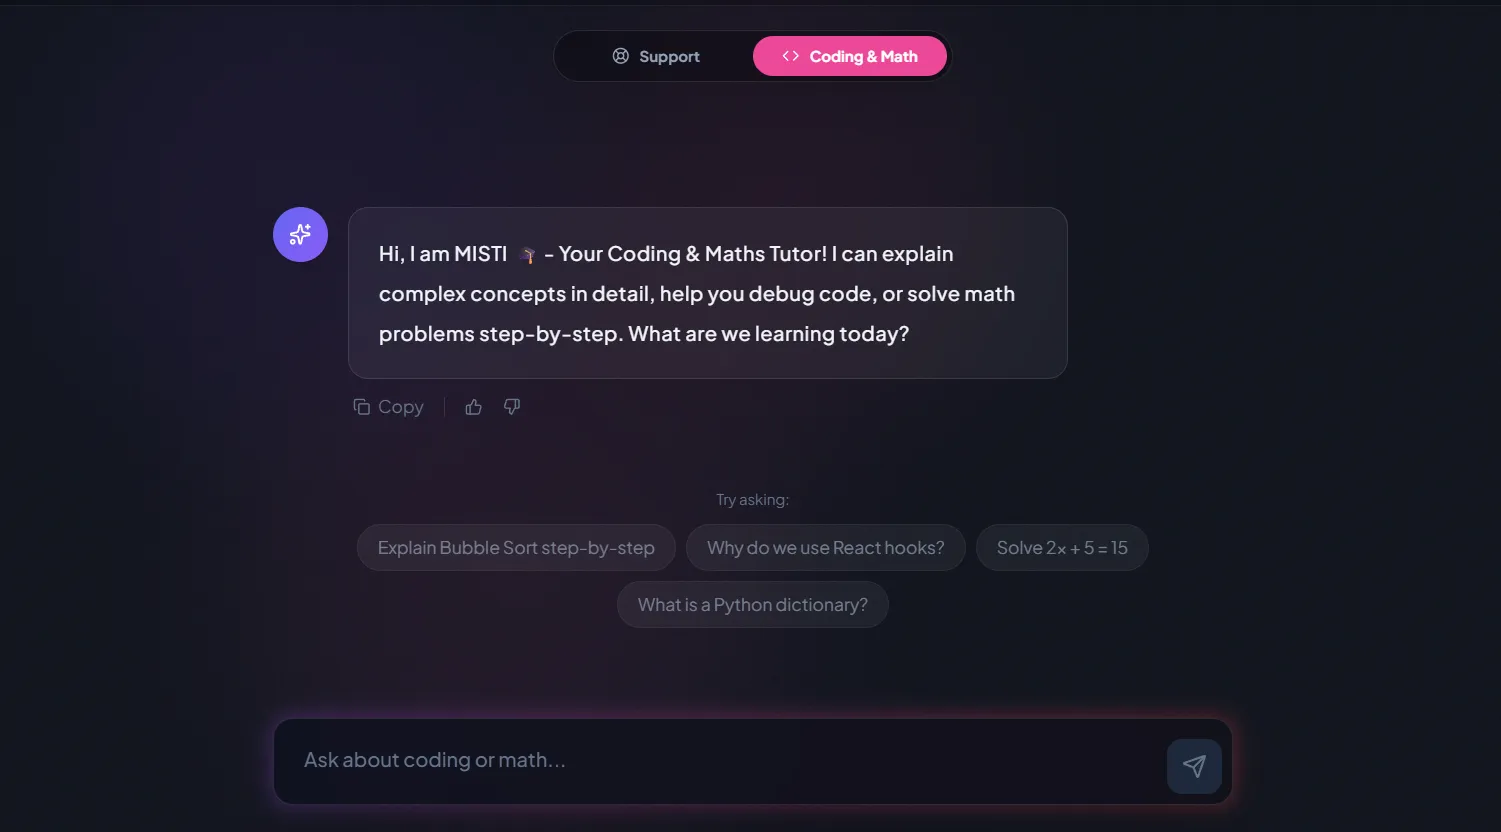
A chatbot that answers mathematics and programming questions, built and deployed by a student.

AI and ML
An assistant that helps a young person recognise unsafe situations online.

Web app
A weather forecasting site with live conditions for any location.
Fees
The first class is on us. After that a single monthly fee, with group places costing less than 1-on-1 lessons. Nothing to sign, and nothing paid before a weekly slot is fixed.
Free first class
USD 0
no card required
Group batch
USD 100
a month, billed in US dollars
One to one
USD 150
a month, billed in US dollars
What families say
Reviews parents left on Google, as written.
★★★★★
"The one step solution for my son. Modern Age Coders make learning coding so simple that kids love it. The teachers explain complex concepts clearly with practical exercises and interactive content."
Ria Mukherjee
Parent
★★★★★
"Modern Age Coders has been a game-changer for me. I struggled to grasp IT concepts and coding before joining, but their classes transformed everything. I can now confidently write complex programs with ease."
Samriddha Mondal
Student
★★★★★
"One of the most wonderful education centres out there. Education is not limited to school syllabus but focuses on skill development."
Vansh Agarwal
Student
★★★★★
"My child Dhairya is really enjoying the Modern Age Coders classes. This is his first online class and he eagerly looks forward to it. I can already see his improvement, and the teachers are very cooperative."
Sonam Oswal
Parent of Dhairya
★★★★★
"Modern Age Coders have wonderful teachers who teach in a clear, easy and practical way. The teacher boosts students' confidence and inspires them to learn without hesitation."
Sonu Goyal
Parent
★★★★★
"I highly recommend this computer coding class! The teachers are incredibly knowledgeable and passionate about coding."
Ritu Kedia
Parent
Questions about GCSE Statistics
No. It is a separate GCSE with its own specification and papers. It overlaps with the statistics and probability in GCSE Maths but adds topics such as Spearman's rank correlation, index numbers, moving averages and capture and recapture.
Two, at either Foundation or Higher tier, each worth 80 marks and half of the GCSE. AQA 8382 papers last 1 hour 45 minutes and Pearson Edexcel 1ST0 papers last 1 hour 30 minutes.
Both AQA and Pearson Edexcel list Paper 1 on the afternoon of Monday 7 June 2027 and Paper 2 on the morning of Wednesday 16 June 2027. Check the school's own timetable as well.
The algebra is lighter than in Higher GCSE Maths, but the challenge is different: a fifth of the marks are for judging methods and conclusions, and those reward practice at explaining rather than calculating.
It is the five-stage process both boards use: initial planning, data collection, processing and presentation, interpretation of results, and evaluation and review. Exam questions can target any stage.
Yes, on every paper. AQA lists a minimum set of functions and says statistical functions may be used but are not required; Pearson expects students to be familiar with the statistical function keys.
On Pearson Edexcel, only at Higher tier, printed on page 2 with skew, standard deviation and Spearman's rank. Pearson's Foundation papers have no sheet. AQA gives formulae such as skewness and rates of change within the questions when they are needed.
AQA says its specification is available to private candidates, including those who are self-taught, home schooled or privately tutored, by entering through an AQA-approved school or college that agrees to host them.
Weekdays or weekends, flexible: choose your batch, or for a very personalised plan choose 1-on-1 at your convenience, weekend mornings or weekdays. All times are in UK time.
No. Modern Age Coders is independent of AQA and Pearson Edexcel. We teach to their published specifications, use their freely available papers, and promise no grade.
Elsewhere on this site
The GCSE beside it and the statistics after it.
The partner GCSE.
For the maths GCSE, where the boards differ more.
The other common second maths qualification.
Where statistics continues after 16.
The American course at the next level.
All our UK pages.
Part of the guide: UK maths exam boards and specification codes
More guides: UK maths year by year, Reception to Year 11 · UK selective school maths tests: 7+, 11+, 13+ and 16+ · UK university admissions: maths tests and computing applications · UK maths enrichment, competitions and able pupils
Start here
Send us a number and a teacher will call at a UK time you prefer. Tell us the board, AQA or Edexcel, and the class uses that board's style from the start.
Like to read first? The Statistics and Probability course page lists the topics, and how we teach describes a class.
WhatsApp us · +91 91233 66161 · connect@modernagecoders.com
WhatsApp is the fastest way to reach us, free from a UK number. Replies come from our India team on a +91 number.
A priority demo is a full class of about 45 to 60 minutes. After the class the mentor sends a written skill report and a personal learning roadmap on WhatsApp. If you enrol, the demo fee is adjusted against your first month's fee. Share your demo Order ID with us on WhatsApp and we take it off.
Book a priority demo