AP Statistics
A statistics course built around one exam: nine AP units, the Investigative Task, and the free-response rubric that decides most of the score.
Syllabus updated August 2026
Questions? WhatsApp +91 91233 66161 or email connect@modernagecoders.com
Recordings are free with a Google sign-in. These recordings show how we teach, not the exact syllabus of this course.
Our promise
The world's best learning experience, open to everyone.
- World-class instructorsEvery class is taught by an instructor who specialises in that exact field.
- No compromise on qualityEvery lesson, project and piece of feedback is held to the highest standard.
- Education for everyoneLearners aged 6 to 67, from first-time beginners to working professionals, in 25+ countries.
If you want the highest quality, Modern Age Coders is the right choice.
Book a Priority DemoHow long this course takes
This course runs 6 months (24 weeks) at 2 live classes/week + 4-5 hours practice. The range allows for background and pace: a complete beginner uses the full span, and a student with prior knowledge finishes sooner. The syllabus below is planned to the shorter end, with margin kept for revision.
For personalised duration planning, call +91 91233 66161 and we'll map a schedule to your goals.
At a glance
- Who it is for
- High school students preparing for AP Statistics; taught from the ground up, comfort with school algebra assumed.
- Prerequisites
- Comfortable school algebra: working with formulas, fractions, percentages and graphs. No calculus is required anywhere in AP Statistics
- Format
- Live, interactive classes with a real instructor, never pre-recorded videos. Live classes run about one hour.
- Language
- English or Hindi, depending on the batch.
- Duration
- 6 months (24 weeks)
- Weekly commitment
- 2 live classes/week + 4-5 hours practice
- Class size
- Group batches of 5 to 10 students, mini batches of 3 to 4, or 1-on-1.
- Certificate
- Certificate from Modern Age Coders, awarded on passing the final assessment
- Watch first
- Free recordings of real classes for ages 13 and up, free with a Google sign-in. These recordings show how we teach, not the exact syllabus of this course.
- Live demo
- Optional. Enrol directly on this page, or book a Priority Demo: a full live class of about 45 to 60 minutes with a mentor reserved for you.
- Questions
- WhatsApp +91 91233 66161 or email connect@modernagecoders.com.
How we teach
Deep understanding. Real projects. Expert guidance.
Learn coding, AI and maths through careful explanations, practical demonstrations, and hands-on problem-solving. Our instructors guide you from the foundations to advanced ideas, helping you understand what happens, why it happens, and how to build it yourself.
You will explore concepts step by step, write and improve code, investigate mistakes, ask questions, and apply your knowledge to meaningful projects. Lessons are designed around active participation, thoughtful feedback, and growing independence.
Expert-led live teaching, with practical participation built into every lesson.
- Students explain their thinking.
- Instructors demonstrate, then guide practice.
- Learners code, solve, or build during lessons.
- Questions and misconceptions get attention.
- Assignments receive useful feedback.
- Progress is checked before advancing.
How to join AP Statistics: Exam Prep with the Investigative Task
Four steps from this page to the first class. See a full class first with a Priority Demo, or choose a plan and enrol today.
Rated 4.9 across 547 Google reviews. Monthly billing, cancel any time.
How enrolment works
See a full class first (optional)
Book a Priority Demo: a live class of about 45 to 60 minutes with a mentor reserved for you, today or tomorrow. After the class the mentor sends a written skill report and a personal learning roadmap on WhatsApp. If you enrol, the demo fee is adjusted against your first month's fee. Share your demo Order ID with us on WhatsApp and we take it off.
Book a Priority DemoDemo fee ₹499Choose a plan
Group batch (5 to 10 students), mini batch (3 to 4 students, India only) or 1-on-1 with your own mentor. Every plan is live online, and each class runs about one hour. The cards below show classes per week and the monthly fee in your currency.
Enrol and pay the first month
Press Enrol Now on your plan, fill in the student's name, email and phone, and pay through secure Razorpay checkout: UPI, cards or net banking in India, and debit or credit card from any other country.
Fix your class timings
After payment, message us on WhatsApp or call +91 91233 66161 with the student's name, the course and your preferred time slot. We confirm the batch, send the class link and schedule the first class at your chosen time.
Billing is monthly and you can cancel any time.
International Students (Outside India)
Billed monthly in US dollars, the same price in every country. Contact us with any questions.
Questions before you enrol? Talk to our team.
Ask about class timings, the right level for your child, what they need to know already, or payment. Parents and adult learners can reach us on WhatsApp, by email or by phone.
Program Overview
AP Statistics is not the same subject as a general college statistics course, even though the two share a name. It is organised around nine specific units, tested on one specific exam, in one specific format, and this course is built around exactly that exam as it exists now, not around statistics in general. The exam runs in two equal halves: Section I is 40 multiple-choice questions in 90 minutes, worth half the score, and Section II is 6 free-response questions in 90 minutes, worth the other half. Of those six, the first five are short-answer questions, budgeted at roughly 12 minutes each, and the sixth is the Investigative Task, a single longer question worth about 30 of those 90 minutes that asks you to apply and extend what you know to a scenario the exam has not shown you before. The exam is also hybrid: multiple-choice questions and the free-response prompts are viewed in the College Board's Bluebook digital testing app, but every free-response answer is handwritten in a paper booklet that is collected and scored separately. A graphing calculator, such as a TI-84, is expected and permitted for the whole exam, and this course teaches its use from week one.
The six-month structure follows the nine AP units in the order the exam tests them. Months 1 and 2 cover Units 1 through 3: exploring one-variable data with the normal model, exploring two-variable data with correlation and least-squares regression, and collecting data through sampling and experimental design. Months 3 and 4 cover Units 4 and 5: probability, random variables, the binomial and geometric distributions, then sampling distributions and the Central Limit Theorem that every later inference procedure depends on. Months 5 and 6 cover Units 6 through 9, formal inference for proportions, means, chi-square settings and regression slopes, then turn fully to exam craft: the Investigative Task practiced as its own skill, every free-response question type drilled against the real rubric, and two full timed mock exams run under the exam's actual hybrid-digital conditions. Because the rubric rewards communication as much as computation, every answer in this course, from week one onward, is written to justify a conclusion with evidence, interpret it correctly in context, and state the conditions it depends on, since a right number with no justification earns limited credit on the real exam.
What Makes This Program Different
- Organised around the nine official AP Statistics units in the order the exam actually tests them, not a general statistics syllabus with an AP label attached
- The Investigative Task, free-response Question 6, practiced as its own skill from month 6 onward, since it is scored differently from the other five questions and most courses barely touch it
- Free-response answers drilled against the communication standard the rubric truly rewards: justifying a conclusion with evidence, interpreting it correctly, and stating the conditions it depends on
- Graphing calculator fluency built in from week 1, since the real exam expects confident use of a calculator such as a TI-84 throughout both sections
- Full readiness for the hybrid-digital format: multiple-choice and free-response prompts viewed in the Bluebook app, but free-response answers handwritten in paper booklets, practiced under those exact conditions
- Live, small batches where you work real data and real free responses during class and get them reviewed, not lecture videos watched alone
Your Learning Journey
Career Progression
Detailed Course Curriculum
Explore the complete week-by-week breakdown of what you'll learn in this comprehensive program.
Topics Covered
- Individuals, variables, and the shape of the AP Statistics course: nine units, two exam sections, and the exam that ends it
- Categorical versus quantitative data, and the type of graph each one calls for
- Dotplots, stemplots and histograms: reading shape, not just drawing it
- Describing a distribution in words: shape, outliers, center and spread, the sentence the exam always wants
- Setting up the graphing calculator: entering lists, running 1-Var Stats, and building a first histogram on screen
- The AP Statistics communication standard: why a correct number with no justification earns limited credit
Projects You Build
- First distribution report: a real one-variable data set displayed, described in full shape-outliers-center-spread sentences, and checked on the calculator
Practice & Assignments
12 distribution-description problems, each answer required to name shape, outliers, center and spread in one paragraph, not a list of numbers
Topics Covered
- Mean and median, and which one a skewed distribution or an outlier pulls away from the other
- Range, interquartile range, and the 1.5 times IQR rule for flagging outliers
- Variance and standard deviation built up from deviations, not dropped as a formula
- The five-number summary, and building a boxplot from it by hand and by calculator
- Choosing mean and standard deviation versus median and IQR to summarise a distribution, and defending the choice
- Comparing two distributions side by side on boxplots, a guaranteed exam question type
Projects You Build
- Center-and-spread comparison: two real groups compared on boxplots with a full written comparison of shape, center, spread and outliers
Practice & Assignments
14 problems computing and choosing summary measures, half requiring a written comparison between two groups
Topics Covered
- The normal curve, its parameters, and the 68-95-99.7 rule
- Standardising a value into a z-score and reading what it says about relative position
- Finding areas under the normal curve on the calculator with normalcdf
- The inverse problem: finding a value from a given percentile with invNorm
- Assessing normality with a normal probability plot, read for curvature rather than computed
- Normal calculations written up in context, the way the exam scores them, not just the final number
Projects You Build
- Normal model check: a real quantitative data set tested against the 68-95-99.7 rule, with normalcdf and invNorm used to answer three context questions
Practice & Assignments
14 normal distribution problems, each opened with a labelled sketch of the curve and the shaded region before any calculator work
Topics Covered
- Pulling Unit 1 together: distributions, summary statistics and the normal model in one paper
- Reading a Unit 1 free-response prompt the way the rubric is written, points named as sentences rather than numbers
- The exam's two sections at a glance: 40 multiple-choice questions in 90 minutes worth 50 percent of the score, and 6 free-response questions in 90 minutes worth the other 50 percent
- Multiple-choice pacing for a Unit 1 style set: roughly two minutes a question
- Common Unit 1 mistakes: describing shape from a boxplot alone, and confusing standard deviation with interquartile range
- Starting a personal error log, kept and grown for the rest of the course
Projects You Build
- First scored free response: a Unit 1 style question written under time and self-scored against a rubric, with every lost point named
Practice & Assignments
A timed Unit 1 multiple-choice set at exam pace, followed by one full free-response question reviewed line by line against its rubric
Assessment
Unit 1 assessment: a timed paper on one-variable data covering multiple-choice and one free response, marked on both the number and the justification
Topics Covered
- Explanatory and response variables, and setting up a scatterplot correctly
- Describing a scatterplot: direction, form, strength and outliers, the two-variable version of shape-outliers-center-spread
- The correlation coefficient r: what it measures and where its usefulness stops
- Correlation is not causation, with a plausible confounding variable named every time
- Computing r on the calculator from two lists
- Why a strong r does not automatically mean a good model, previewing residuals
Projects You Build
- Relationship study: a real two-variable data set plotted, described in full, and its correlation computed and interpreted in context
Practice & Assignments
12 scatterplot and correlation problems, every claim of a relationship backed by a described scatterplot, not just an r value
Topics Covered
- The least-squares regression line and exactly what quantity it minimises
- Finding the equation on the calculator with LinRegTTest, and reading slope and intercept in context
- The coefficient of determination, r-squared, and what percentage of variation it explains
- Residuals and the residual plot: the honesty check the exam consistently asks for
- Predicting within the range of the data versus extrapolating beyond it
- Influential points and outliers in a regression setting
Projects You Build
- Prediction model: a regression line fit to real data, its residual plot checked for pattern, and two predictions made with their limits stated
Practice & Assignments
12 regression problems with slope and intercept interpreted in the units of the problem every time, plus 4 residual-plot readings
Topics Covered
- Population versus sample, and why that distinction drives all of Unit 3
- Simple random samples, stratified samples, cluster samples and systematic samples
- Convenience sampling and voluntary response, and why both are biased by design
- Sources of bias: undercoverage, nonresponse, and response bias from question wording
- How a sampling method is described and evaluated on the free-response section
- Designing a sampling plan for a given population and research question
Projects You Build
- Sampling critique: a real published survey evaluated for its sampling method, with specific bias risks named in writing
Practice & Assignments
10 sampling-design problems, each requiring the method to be named and one bias risk identified
Topics Covered
- Observational studies versus experiments, and what only a well-designed experiment can show
- Experimental design vocabulary: treatments, experimental units, and the placebo effect
- The principles of good experimental design: control, randomisation, and replication
- Blocking and why it is used, contrasted with a completely randomised design
- Confounding variables in an experiment versus in an observational study
- Units 2 and 3 pulled together, with a timed multiple-choice set mixing both
Projects You Build
- Experiment design: a full experimental design written for a given research question, naming treatments, randomisation and control
Practice & Assignments
10 experimental-design problems plus a timed Unit 2-3 multiple-choice set reviewed question by question
Assessment
Unit 2-3 assessment: a timed paper on two-variable data and data collection, including one regression free response and one design free response
Topics Covered
- Randomness, probability as long-run relative frequency, and simulating it on the calculator
- Sample spaces, events, and the basic probability rules
- The addition rule for mutually exclusive and overlapping events
- Conditional probability, and what being told the condition changes about the sample space
- Independence: the definition, and testing for it using a two-way table
- The multiplication rule for independent and dependent events
Projects You Build
- Two-way table study: a real two-way table used to compute conditional probabilities and formally test two events for independence
Practice & Assignments
14 probability problems from single events through conditional probability, independence checked by calculation, not by eye
Topics Covered
- Discrete random variables and their probability distributions
- Mean, or expected value, of a discrete random variable, and what it means for a variable that only takes whole values
- Standard deviation of a discrete random variable
- Combining random variables: rules for the mean and variance of sums and differences
- Independence between two random variables, and why it matters before combining variances
- Random variables in context: insurance, games, and simple business scenarios
Projects You Build
- Combined-variable analysis: two random variables combined by sum or difference, with mean and standard deviation of the result found and interpreted
Practice & Assignments
12 random variable problems including 4 combination questions checked for the independence condition first
Topics Covered
- The binomial setting: the four conditions checked in words before any formula is used
- Binomial probability, mean and standard deviation, by hand and with binompdf and binomcdf
- The geometric setting: waiting for the first success
- Geometric probability, mean and standard deviation, with geometpdf and geometcdf
- Choosing between a binomial and a geometric model from the story in the question
- The 10 percent condition: when sampling without replacement behaves close enough to independent
Projects You Build
- Model choice project: three real scenarios each modelled correctly as binomial or geometric, with the setting's conditions checked in writing
Practice & Assignments
14 binomial and geometric problems, the first written step always naming and checking the setting's conditions
Topics Covered
- Pulling Unit 4 together: probability rules, random variables, binomial and geometric models
- Reading a probability free-response question for exactly what it asks: a probability, a mean, or a standard deviation
- Common Unit 4 mistakes: using a binomial model when trials are not independent, and misreading at least versus more than
- Calculator fluency check: normalcdf, invNorm, binompdf, binomcdf, geometpdf and geometcdf used correctly and quickly
- A timed Unit 4 multiple-choice set at exam pace
- Error log review: Unit 4 mistakes classified and drilled
Projects You Build
- Timed probability free response written under exam conditions and self-scored against a rubric
Practice & Assignments
A timed Unit 4 multiple-choice set plus one full free-response question reviewed against its rubric
Assessment
Unit 4 assessment: a timed paper on probability, random variables and probability distributions, including one free response
Topics Covered
- Parameter versus statistic, and why every sample gives a slightly different answer
- The idea of a sampling distribution: the distribution of a statistic over repeated samples
- Simulating a sampling distribution on the calculator to watch shape, center and spread build up
- The sampling distribution of a sample proportion: its mean, its standard deviation, and when it is approximately normal
- The conditions for that normal approximation: random, 10 percent, and large counts
- Unbiased estimators, and why the sample proportion is one for the population proportion
Projects You Build
- Simulation build: a sampling distribution for a proportion simulated by hand or calculator, with shape, center and spread reported from the simulation
Practice & Assignments
10 sampling-distribution problems for proportions, each requiring the three conditions checked before any normal calculation
Topics Covered
- The sampling distribution of a sample mean: its mean and its standard deviation
- The Central Limit Theorem stated precisely: what a large sample size buys you even from a skewed population
- Watching the Central Limit Theorem happen: simulating sample means from a skewed population as sample size grows
- When the population itself is already normal, and why a large sample size is not needed then
- The 10 percent condition applied to sample means
- Common misreadings of the theorem, including confusing the population's shape with the sampling distribution's shape
Projects You Build
- Central Limit Theorem simulation: sample means drawn repeatedly from a skewed population, with the resulting shape compared at small and large sample sizes
Practice & Assignments
10 sampling-distribution problems for means, plus the simulation repeated on a second population shape
Topics Covered
- The sampling distribution of a difference in two proportions
- The sampling distribution of a difference in two sample means
- Conditions for each, including independence between the two samples
- Reading a scenario to decide which sampling distribution applies: one sample or two, proportion or mean
- Connecting Unit 5 forward to Units 6 and 7: every confidence interval and test still to come rests on one of these distributions
- Free-response practice describing a sampling distribution in full: shape, center, spread and the conditions that justify each
Projects You Build
- Distribution identification drill: ten scenarios each matched to the correct sampling distribution, with mean, standard deviation and conditions stated
Practice & Assignments
12 mixed sampling-distribution problems where the question never announces which distribution to use
Topics Covered
- Pulling Unit 5 together: sampling variability and every sampling distribution covered so far
- A worked preview of how a confidence interval is really a sampling distribution centered on a statistic
- A worked preview of how a significance test asks whether a statistic is surprising given an assumed sampling distribution
- A timed multiple-choice set at exam pace covering Units 4 and 5 together
- Error log review: probability and sampling-distribution mistakes classified and drilled
- Calculator fluency check across every function used so far in the course
Projects You Build
- Timed Unit 5 free response written under exam conditions and self-scored against a rubric
Practice & Assignments
A timed Units 4-5 multiple-choice set plus one full free-response question reviewed against its rubric
Assessment
Unit 5 assessment: a timed paper on sampling distributions, including one free response connecting a distribution to its conditions
Topics Covered
- The logic of a confidence interval: an interval built to have a stated chance of capturing the true parameter
- The conditions for inference on one proportion: random, 10 percent, and large counts
- Constructing a one-sample z-interval for a proportion, by hand and with the calculator
- Margin of error, and the three things that change it
- What 95 percent confidence actually means, and the misreadings the exam is built to catch
- Confidence intervals for a difference in two proportions
Projects You Build
- Interval report: a confidence interval for a real proportion built from data, with the correct interpretation written out in full context
Practice & Assignments
12 proportion-interval problems, every interval followed by a correctly worded, in-context interpretation sentence
Topics Covered
- Stating null and alternative hypotheses correctly for a one-proportion test
- The test statistic, the p-value, and what a p-value actually measures
- Checking the same three conditions before trusting a test
- One-sample and two-sample z-tests for proportions, by hand and with the calculator
- Type I and Type II errors, and significance level as the Type I error rate you choose
- Writing a full test conclusion in context: state, plan, do, conclude, the four-step structure the rubric rewards
Projects You Build
- Claim test: a real claim about a proportion tested against data, written up in the full state-plan-do-conclude structure
Practice & Assignments
12 proportion-test problems, every conclusion written in context and linked back to the p-value
Topics Covered
- Why a t-distribution, not a normal distribution, is used for inference on a mean
- Degrees of freedom in plain language, and how the t-distribution compares to normal as they grow
- The conditions for inference on one mean: random, 10 percent, and normal or large sample
- Constructing a one-sample t-interval for a mean, by hand and with the calculator
- Confidence intervals for a difference in two means, paired and unpaired designs told apart
- Recognising a paired design, a frequent trap on the exam
Projects You Build
- Interval report: a confidence interval for a real mean built from data, with the paired-versus-unpaired decision justified in writing
Practice & Assignments
12 mean-interval problems including two paired designs hidden among unpaired ones
Topics Covered
- One-sample and two-sample t-tests for means, hypotheses stated and conditions checked every time
- Paired t-tests, and why they are really a one-sample test performed on the differences
- Effect size, and why a significant result is not automatically an important one
- Pulling Units 6 and 7 together: proportions and means, intervals and tests, side by side
- A timed multiple-choice set at exam pace covering both units
- Error log review: inference mistakes classified, especially condition-checking and interpretation wording
Projects You Build
- Timed inference free response written under exam conditions and self-scored against a rubric
Practice & Assignments
A timed Units 6-7 multiple-choice set plus one full free-response question reviewed against its rubric
Assessment
Unit 6-7 assessment: a timed paper on inference for proportions and means, including one free response scored on conditions and conclusion wording
Topics Covered
- The chi-square goodness-of-fit test: does one categorical variable match a claimed distribution
- The chi-square test for independence: are two categorical variables related, within one sample
- The chi-square test for homogeneity: do several populations share the same distribution, and how it differs from independence
- Expected counts, the conditions for a valid chi-square test, and computing the test statistic
- Running each chi-square test on the calculator and reading its output correctly
- Writing a full chi-square conclusion in the state-plan-do-conclude structure
Projects You Build
- Independence study: a real two-way table tested for independence, with expected counts shown and a full written conclusion
Practice & Assignments
12 chi-square problems split across the three test types, the correct type identified from the scenario before any calculation
Topics Covered
- The population regression model, and what the true value of the slope represents
- Conditions for inference on a slope, read from a residual plot and a normal probability plot of residuals
- The t-test for the slope: hypotheses, test statistic, and reading calculator regression output
- The confidence interval for the slope, constructed from the same output
- Connecting Unit 9 back to Unit 2: the regression skills from month 2, now formally tested
- Interpreting a slope-test conclusion in the context of the original two variables
Projects You Build
- Slope inference project: a real two-variable data set tested for a nonzero slope, with conditions checked from residual and normal plots
Practice & Assignments
10 slope-inference problems, conditions checked from a described or sketched residual plot every time
Topics Covered
- What free-response Question 6, the Investigative Task, actually asks: applying and extending the course's skills to a scenario that will not look familiar
- Why the Investigative Task is scored differently from Questions 1 through 5, and what that means for pacing, roughly 30 of the 90 free-response minutes
- Reading an unfamiliar prompt calmly: identifying which unit's tools actually apply underneath the new dressing
- Extending a known method one step further than it was originally taught, the specific skill the task tests
- Working through released Investigative Task style prompts, one full task per session
- Building a personal checklist for the task: state assumptions, justify every step, and answer the question actually asked
Projects You Build
- Two full Investigative Task style responses written under time and self-scored against a released-style rubric, with the extension step highlighted
Practice & Assignments
Two more Investigative Task style prompts worked untimed first for understanding, then timed, with every assumption stated in writing
Topics Covered
- A first complete timed mock exam: all 40 multiple-choice questions and all 6 free-response questions, including the Investigative Task
- Running the mock under real hybrid-digital conditions: multiple-choice and free-response prompts viewed digitally, free-response answers handwritten on paper
- Scoring the mock against official-style rubrics and converting toward the 1 to 5 scale
- A second complete timed mock, then closing whatever gaps the first one exposed
- Test-day logistics: the Bluebook app, the graphing calculator, the paper answer booklets, and timing across both sections
- A one-page, evidence-based test-day plan built from your own two mock scores
Projects You Build
- Two full mock exams, scored, with a written comparison of the two and a final one-page test-day plan
Practice & Assignments
Both full timed mocks plus a complete review, every missed multiple-choice question re-worked and every free response re-scored
Assessment
Final assessment: a complete timed mock exam under hybrid-digital conditions, a progress summary from week 1 to now, and certificate review
Projects You'll Build
Build a professional portfolio with A portfolio of unit projects across all nine AP units plus multiple scored free responses, two Investigative Task responses and two complete timed mock exams real-world projects.
Weekly Learning Structure
Certification & Recognition
Technologies & Skills You'll Master
Comprehensive coverage of the entire modern web development stack.
Support & Resources
Career Outcomes & Opportunities
Transform your career with industry-ready skills and job placement support.
Prerequisites
Who Is This Course For?
Career Paths After Completion
Course Guarantees
Real students. Real moments. Real joy.
These are our actual student meetups. No stock photos, no filters. Swipe through and meet the community you'll be joining.







































What families say
Straight from the parents and students who learn with us. Rated 4.9 across 547 Google reviews.
“Mivaan enjoys the class. He understands the concepts and completes his tasks with excitement. He started taking interest in coding… truly amazing class.”
“I absolutely love it here! I made new friends and learned important valuable coding skills while having the fun of my life. It's not just coding here, it's outings, bonding and most importantly preparing you for your future. Definitely five stars.”
“What stands out most is how excited my son is before every class. He looks forward to learning, problem-solving, and sharing what he's built. I've noticed a big boost in his confidence!”
“Modern Age Coders has been a game-changer for me! I struggled to grasp IT concepts and coding before joining, but their classes transformed everything. I'm now the topper in my class and can confidently write complex programs with ease.”
“Modern Age Coder have wonderful teachers who teach in a clear, easy and practical way. The teacher boosts students' confidence, keeps them updated with technology, and inspires them to learn without hesitation.”
“The one step solution for my son. Modern Age Coders make learning coding so simple that kids love it.”
“Coding classes here make learning very interesting and conceptual. The teachers teach us in a very easy-to-understand and efficient manner.”
“One of the most wonderful education centres out there. Education is not limited to school syllabus but focuses on skill development. Learning here has been a wonderful journey and still continuing.”
“I highly recommend this computer coding class! The teachers are incredibly knowledgeable and passionate about coding. They make every session engaging and insightful.”
“My child Dhairya is really enjoying the Modern Age Coder IT classes. This is his first online class, and he eagerly looks forward to it.”
“Very good classes. Don't worry about coding. They teach the best, especially Shivam sir.”
“Very good classes. Makes learning very easy and interactive.”
Hear it from our students
Real parents and students in their own words, on our public YouTube channel.
Straight answers about AP Statistics: Exam Prep with the Investigative Task
- Who should take this course?
- High school students preparing for AP Statistics; taught from the ground up, comfort with school algebra assumed. It suits students taking ap statistics at school who want a structured, unit-by-unit course and real feedback on their free responses alongside their class; students whose school does not offer ap statistics and who are preparing for the exam independently; students aiming for a strong score who want free-response drilling against the real rubric, investigative task practice, and full timed mock exams.
- What will they learn and build?
- AP Statistics is not the same subject as a general college statistics course, even though the two share a name. It is organised around nine specific units, tested on one specific exam, in one specific format, and this course is built around exactly that exam as it exists now, not around statistics in general.
- How deeply are topics covered?
- The course runs 6 months (24 weeks) at 2 live classes/week + 4-5 hours practice, across 3 phases listed week by week in the syllabus below. A structured curriculum that follows the current nine-unit AP Statistics course in order, with hands-on data analysis and calculator work in every session.
- Who teaches it?
- Modern Age Coders mentors, who teach the live classes themselves. You can watch them at work in the free class recordings before you decide.
- How do practice, feedback and assessment work?
- Classwork every session, a task after every class, monthly reviews that mix in earlier topics, and a full mock paper as the final assessment that decides the certificate: real knowledge and real work, with a free retest after revision if needed. Doubt support between classes over WhatsApp, so a stuck problem does not cost you a week. A certificate you earn by passing the final assessment, with a free retest after revision if needed.
- What does it cost?
- Three monthly plans: a group batch, a mini batch and 1-on-1. Prices are shown in your currency in the plans section. Monthly billing, cancel any time.
- When can classes take place?
- Live classes are scheduled around your week. Group batches meet at a fixed weekly slot; 1-on-1 students choose their own. International students are scheduled in their own timezone. Ask on WhatsApp for the current slots.
- Can I watch the teaching before deciding?
- Yes. Full recordings of real 13 and up classes are free to watch, free with a Google sign-in. These recordings show how we teach, not the exact syllabus of this course. Some classes are in English and some in Hindi; everyone follows at their own pace. Watch a class end to end, like you are in it. Sessions are interactive and each moment builds on the last.
- Can I enroll without a live demo?
- Yes. Choose a plan on this page and enrol directly; a demo is not required. If you would like to see a full class with a mentor first, book a Priority Demo.
- How do I reach you with a question?
- WhatsApp +91 91233 66161, email connect@modernagecoders.com, or call +91 91233 66161. Tell us the student's age and what they have learned so far, and we will point you to the right plan and batch.
Common Questions About AP Statistics: Exam Prep with the Investigative Task
Get answers to the most common questions about this comprehensive program
Still have questions? We're here to help!
Contact UsRelated Courses You May Like
Continue your learning journey with these recommended programs
 Advanced Placement Mathematics
AP Precalculus: Units 1 to 3 and Full Exam Prep
Live online AP Precalculus exam prep covering Units 1-3: functions, exponentials, trig and polar. Sm...
Explore Course Web Development
MERN Stack Course: MongoDB, Express, React and Node
MERN stack course for college students and professionals: JavaScript foundations, React, Node and Ex...
Explore CourseRelated Articles & Guides
Deepen your knowledge with these hand-picked articles
 Mathematics
9 min read
Mathematics
9 min read
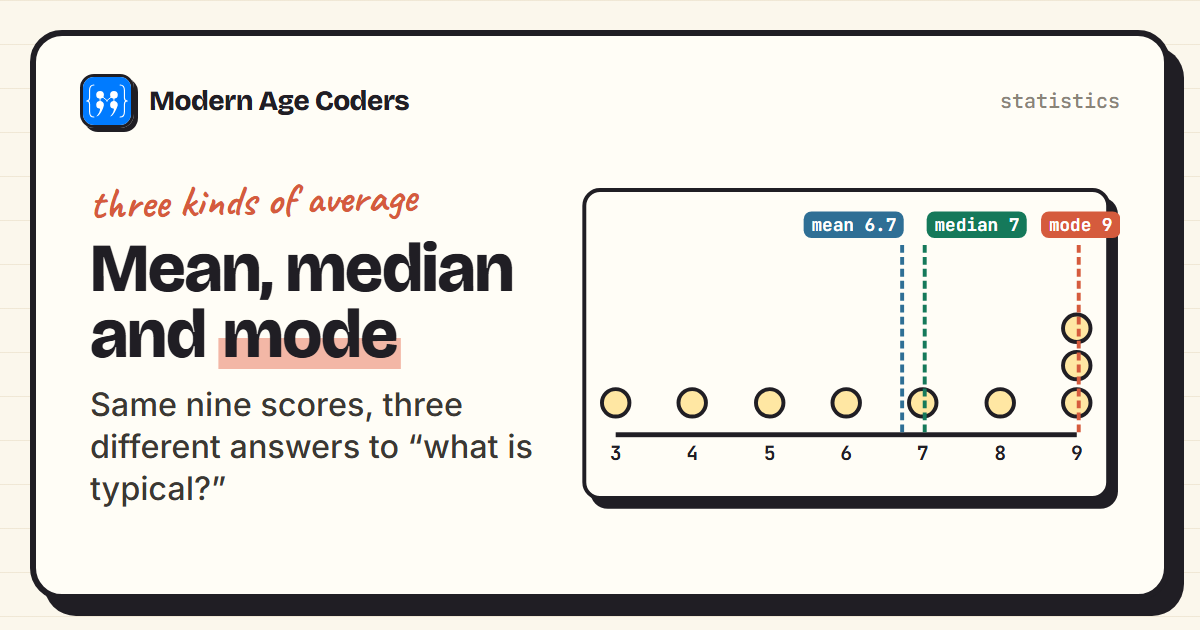
Mean, Median and Mode Explained, With Examples
Mean, median and mode explained with worked examples: how to find each, the median of an even set, m...
Read Article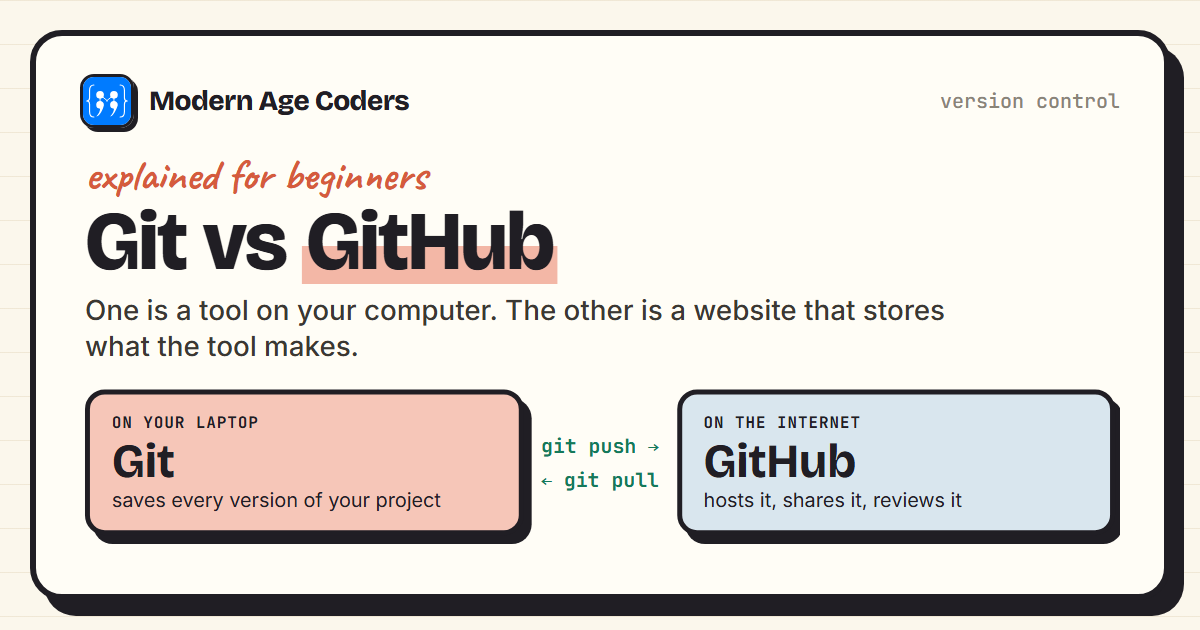 Programming
9 min read
Programming
9 min read
Git vs GitHub: The Difference, With a Real Session
Git vs GitHub explained: Git tracks versions on your computer, GitHub hosts them online. See a real ...
Read ArticleReady to start AP Statistics: Exam Prep with the Investigative Task?
Book a Priority Demo to see a full live class with a mentor reserved for you, today or tomorrow. Or choose a plan and enrol now.
Questions? WhatsApp +91 91233 66161 or email connect@modernagecoders.com