ST / F / 01
Algebra foundations
Linear models start here.
Open the syllabusUnited States · High school math · Statistics and probability
Plenty of high school students meet statistics outside the AP track: a semester elective, a unit inside Integrated Math, the data chapters of Algebra 1 and 2, or an introductory statistics course. The arithmetic is rarely the problem. The trouble is the reasoning: why the median beats the mean on skewed data, which way round a conditional probability goes, and what a margin of error actually promises. This page lays out what the Common Core asks for, then works through it.
Live math teaching since 2020 · 10,000+ students · grades 9 to 12
In short
High school statistics outside AP follows the Common Core Statistics and Probability category: interpreting categorical and quantitative data (S-ID), making inferences and justifying conclusions (S-IC), conditional probability (S-CP) and, for advanced courses, using probability to make decisions (S-MD). Modern Age Coders teaches it live online, in a batch of 15 to 20 or 1-on-1, through our Statistics and Probability course.
Statistics courses
The statistics course matches a school semester; the other two serve students heading for the AP exam or toward data work.
What is taught
Four domains sit in the Common Core's Statistics and Probability category. Most non-AP courses teach the first three in full and dip into the fourth.
| Domain | Code | Clusters, in the standards' own headings |
|---|---|---|
| Interpreting Categorical and Quantitative Data | S-ID | Summarize, represent, and interpret data on a single count or measurement variable; on two categorical and quantitative variables; interpret linear models |
| Making Inferences and Justifying Conclusions | S-IC | Understand and evaluate random processes underlying statistical experiments; make inferences and justify conclusions from sample surveys, experiments and observational studies |
| Conditional Probability and the Rules of Probability | S-CP | Understand independence and conditional probability and use them to interpret data; use the rules of probability to compute probabilities of compound events in a uniform probability model |
| Using Probability to Make Decisions | S-MD | Calculate expected values and use them to solve problems; use probability to evaluate outcomes of decisions (all standards marked (+)) |
Sources: Common Core High School Statistics and Probability and its domain pages for S-ID, S-IC, S-CP and S-MD.
The Common Core mathematics document marks with (+) the "Additional mathematics that students should learn in order to take advanced courses such as calculus, advanced statistics, or discrete mathematics."
It adds that "All standards without a (+) symbol should be in the common mathematics curriculum for all college and career ready students." So S-ID, S-IC and most of S-CP are meant for everyone, while expected value and the general Multiplication Rule are extras that a statistics elective often includes.
The Common Core introduction puts it plainly: decisions would be easy "if the data always sent a clear message, but the message is often obscured by variability." Statistics, it says, "provides tools for describing variability in data and for making informed decisions that take it into account."
Algebra rewards one right answer. Statistics rewards a justified judgment: which plot, which measure of center, how much to trust a sample. That shift is where most of our tutoring time goes.
The introduction describes distributions as "symmetric, skewed, flat, or bell shaped" and pairs mean with standard deviation, median with interquartile range.
Random samples support conclusions about a population; random assignment supports a fair comparison of treatments.
A model is "a list or description of the possible outcomes (the sample space)", each given a probability.
Hard ideas
In our teaching, four ideas cause most of the lost marks: choosing a summary, reading conditional probability, the logic of randomization, and correlation. Each has a precise line in the standards.
| Sticking point | Standard | What the standard says | Habit we build |
|---|---|---|---|
| Mean or median? | S-ID.A.2, A.3 | Use statistics appropriate to the shape of the data; account for possible effects of extreme data points (outliers) | Plot first, then pick the summary |
| Which way is the condition? | S-CP.A.3, A.5 | Conditional probability of A given B as P(A and B)/P(B); explain it in everyday language | Say "out of the ones that..." aloud before dividing |
| Why randomize? | S-IC.B.3 | Recognize the purposes of and differences among sample surveys, experiments, and observational studies; explain how randomization relates to each | Name the study type before any conclusion |
| Correlation is not proof | S-ID.C.9 | Distinguish between correlation and causation | Ask what else could explain the pattern |
The standards say "Randomization has two important uses in drawing statistical conclusions." A random sample makes it possible to draw valid conclusions about a whole population; random assignment "allows a fair comparison of the effectiveness of those treatments."
Students often blur the two. A survey of randomly chosen students can describe the school but cannot show cause; a randomized experiment can suggest cause but only for the people like those in it.
The Common Core defines it in one sentence: "A statistically significant outcome is one that is unlikely to be due to chance alone, and this can be evaluated only under the condition of randomness."
At this level, students judge significance with simulation rather than formulas. S-IC.B.5 asks them to "use simulations to decide if differences between parameters are significant", which is why our lessons lean on short Python simulations.
The last S-IC standard is the one that lasts longest after school ends: "Evaluate reports based on data." The introduction asks students, when reading statistics in the news, "to consider the study design, how the data were gathered, and the analyses employed as well as the data summaries and the conclusions drawn." We finish most units with a short report, written by us, for students to take apart.
Worked examples
Five examples we wrote ourselves, one per sticking point plus an expected value. None is taken from a textbook, a state test or a released item.
| Studies more than 5 hours | Studies 5 hours or less | Total | |
|---|---|---|---|
| Has a part-time job | 24 | 56 | 80 |
| No part-time job | 54 | 66 | 120 |
| Total | 78 | 122 | 200 |
| Question | Working | Answer |
|---|---|---|
| P(studies more than 5 hours, given a job) | Restrict to the job row: 24 out of 80 | 0.30 |
| P(studies more than 5 hours, given no job) | Restrict to the no-job row: 54 out of 120 | 0.45 |
| P(has a job, given studies more than 5 hours) | Restrict to the first column: 24 out of 78 | about 0.31 |
| Are job and long study independent? | P(job) x P(long study) = 0.40 x 0.39 = 0.156, but P(both) = 24/200 = 0.12 | No, the product rule fails |
| Does a job cause less study? | This is an observational survey, not an experiment | Not shown; only an association |
| Step | Working | Result |
|---|---|---|
| Mean | 217 divided by 8 | 27.125 minutes |
| Median | Average of the 4th and 5th values, 18 and 20 | 19 minutes |
| Quartiles | Q1 = median of 12, 15, 15, 18; Q3 = median of 20, 22, 25, 90 | Q1 = 15, Q3 = 23.5 |
| IQR and fence | IQR = 8.5; upper fence = 23.5 + 1.5 x 8.5 | 36.25, so 90 is an outlier |
| Choice of summary | One value drags the mean above seven of the eight students | Report median and IQR |
import random

# A sample of 100 students: 58 said yes. How far might a sample proportion wander?
p_hat, n, trials = 0.58, 100, 10000
results = []
for _ in range(trials):
    yes = sum(1 for _ in range(n) if random.random() < p_hat)
    results.append(yes / n)

results.sort()
low, high = results[int(0.025 * trials)], results[int(0.975 * trials)]
print(f"middle 95% of simulated proportions: {low:.2f} to {high:.2f}")
print(f"margin of error is about {(high - low) / 2:.2f}")   # close to 0.10
Our simulation for S-IC.B.4, which asks students to "develop a margin of error through the use of simulation models for random sampling." Each run differs slightly; the margin comes out near 0.10, so a fair report is "about 48% to 68% say yes".
| Problem | Reasoning | Result |
|---|---|---|
| A line fitted to quiz score against hours studied is y = 2.4x + 31, with r = 0.62. Interpret it. | Slope: each extra hour goes with about 2.4 more points. Intercept: the model predicts 31 at zero hours. r = 0.62 is a moderate positive linear association. | Association, not proof that studying caused the gain |
| A spinner awards 0 points half the time, 2 points a third of the time and 6 points a sixth of the time. What is the expected score per spin? | 0 x 1/2 + 2 x 1/3 + 6 x 1/6 = 0 + 2/3 + 1 | 5/3, about 1.67 points |
Practice
Twelve short problems we wrote across the four domains, then a plan for supporting a one-semester school course.
| # | Domain | Problem | Answer |
|---|---|---|---|
| 1 | S-ID | Data: 3, 4, 4, 5, 9. Find the mean and the median. | Mean 5, median 4 |
| 2 | S-ID | Which plot shows the five-number summary directly? | A box plot |
| 3 | S-ID | A data set is strongly right-skewed. Which measure of center fits better? | The median |
| 4 | S-ID | Heights are roughly normal with mean 160 cm and standard deviation 8 cm. About what percent lie between 152 and 168? | About 68% |
| 5 | S-ID | Is r = -0.9 weaker than r = 0.5? | No, it is stronger (negative) |
| 6 | S-IC | A gym asks its own members whether exercise matters. What is the problem? | The sample is not random; it is biased |
| 7 | S-IC | Volunteers choose whether to try a new study app. Survey, experiment or observational study? | Observational study |
| 8 | S-IC | A spinning coin lands tails 5 times in a row. Under a fair model, how likely is that? | 1/32, about 0.03 |
| 9 | S-CP | Number cube: P(even or greater than 4)? | 4/6 = 2/3 |
| 10 | S-CP | P(A) = 0.5, P(B) = 0.4, P(A and B) = 0.2. Independent? | Yes, 0.5 x 0.4 = 0.2 |
| 11 | S-CP | P(A and B) = 0.12 and P(B) = 0.3. Find P(A given B). | 0.4 |
| 12 | S-MD | A fair number cube scores its face value. Expected score? | 3.5 |
This plan is ours and follows the order of the Common Core domains; the teacher reorders it to fit the student's school textbook and test dates. We never complete graded homework or school projects for a student. We teach the method, and the student does the work.
Where statistics appears
One state's published pathway shows how statistics threads through every year. Utah's graduation pathways chart, from the Utah State Board of Education in 2021, is the example here.
| Course or stage | Statistics content Utah lists |
|---|---|
| Secondary Math I | Descriptive Statistics |
| Secondary Math II | Conditional Probability |
| Secondary Math III | Data Collection and Analysis |
| Alternative selection (after Secondary Math II) | Introductory Statistics |
| College mathematics credit (after Secondary Math III) | A college Statistics course, or AP Statistics |
Utah says its alternative courses, Introductory Statistics among them, "meet graduation requirements but are not sufficient to meet post-secondary requirements."
Families choosing a statistics elective should check whether it is meant as preparation for college math, or as an interest course.
Utah's concurrent enrollment flyer describes its Statistics course as one that "Covers descriptive and statistical methods used to understand data", recommended for majors such as nursing, psychology and the social sciences.
Other states name and sequence their courses differently, so check your own district's course guide.
The catalogue
Courses for the algebra statistics leans on, for the AP route, and for students who want to use data in code.
ST / F / 01
Linear models start here.
Open the syllabusST / F / 02
Grades 9 to 12 in sequence.
Open the syllabusST / F / 03
Grade 6 to 8 data and probability.
Open the syllabusST / S / 01
The non-AP course.
Open the syllabusST / S / 02
Course and exam.
Open the syllabusST / S / 03
Data questions included.
Open the syllabusST / D / 01
Statistics with real data.
Open the syllabusST / D / 02
Simulation in Python.
Open the syllabusST / D / 03
After high school.
Open the syllabusHow lessons run
Weekdays or weekends, flexible: choose your batch, or for a very personalised plan choose 1-on-1 at your convenience, weekend mornings or weekdays.
Weekdays
After school, timed to the unit in class.
Weekends
Longer sessions with a data set to explore.
1-on-1
Built around the student's own textbook.
Every data question starts with a picture.
Interpretations written in context.
Randomness students can watch.
Conditional probability said in words.
Our own news-style claims to test.
Fifteen to twenty, or just one.
Student work
Some students go on to chart their own data in code. See more on student labs.
AI and ML
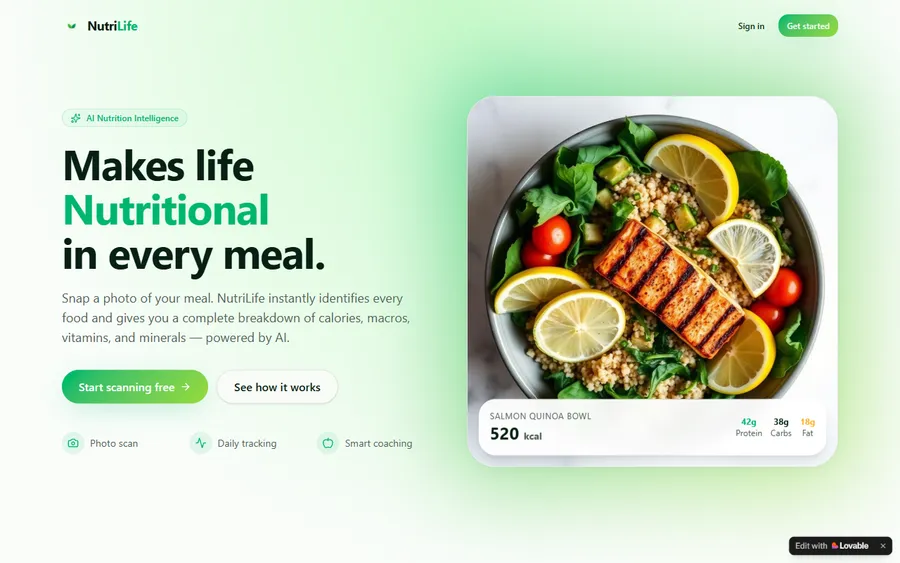
An AI nutrition coach that reads what you eat and works you toward a target.
AI and ML
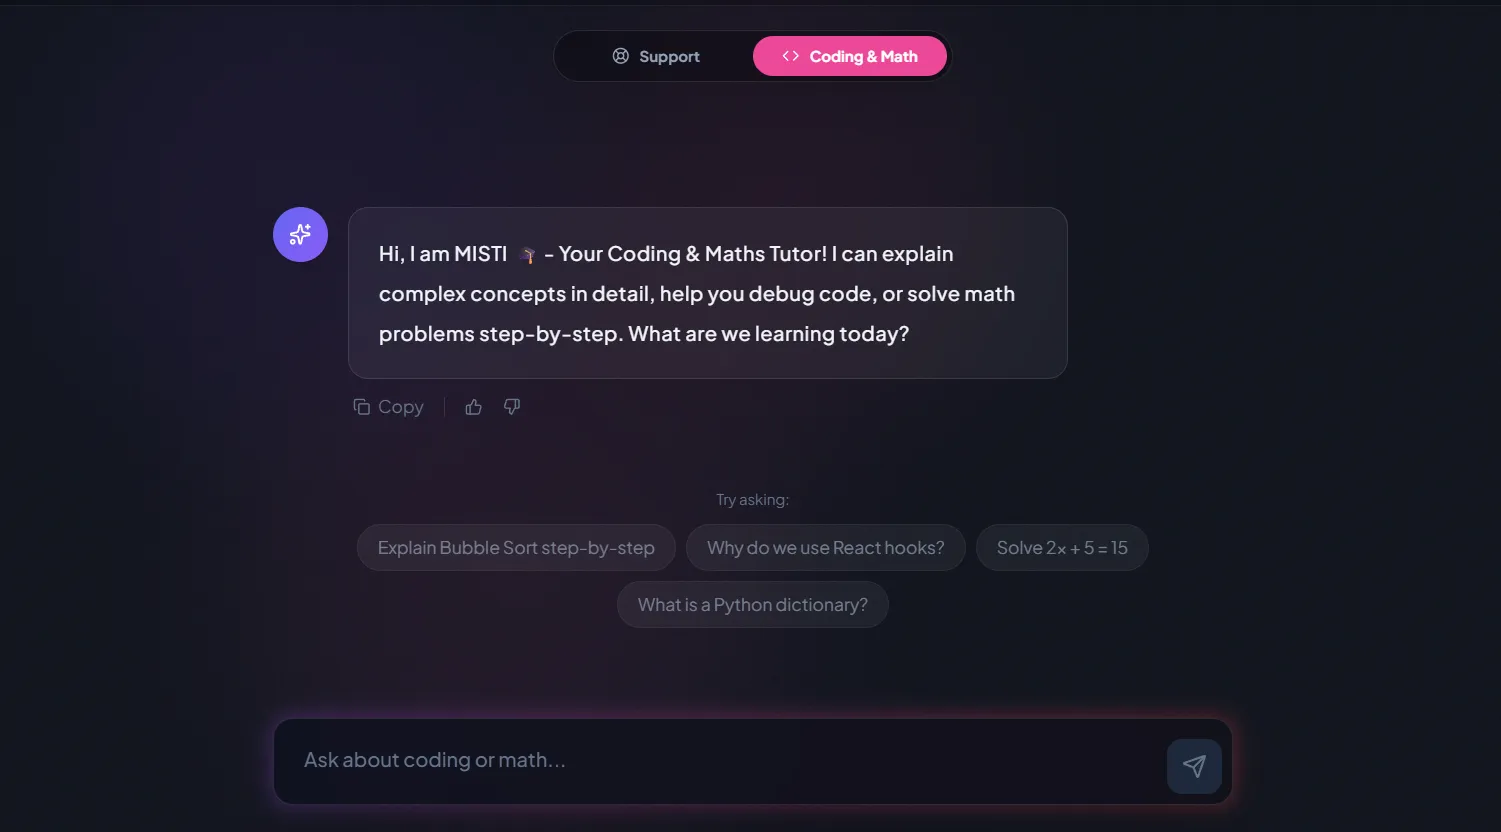
A chatbot that answers mathematics and programming questions, built and deployed by a student.

AI and ML
An assistant that helps a young person recognise unsafe situations online.
Web app
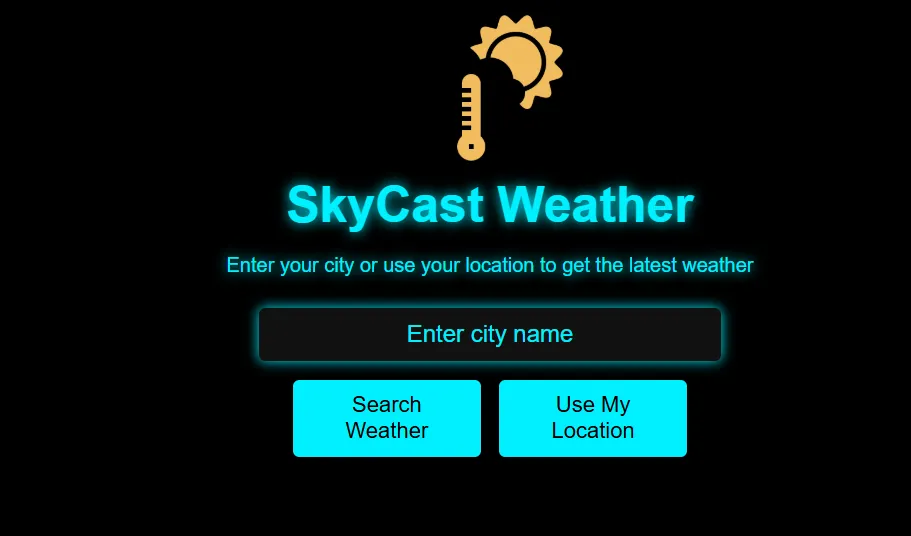
A weather forecasting site with live conditions for any location.
Fees
Statistics classes are billed monthly in US dollars, with no long contract. The first class costs nothing, so a student can try a lesson before a parent decides.
Free first class
USD 0
no card required
Group batch
USD 100
a month, billed in US dollars
One to one
USD 150
a month, billed in US dollars
What families say
What families and students have written about us on Google, unedited.
★★★★★
"The one step solution for my son. Modern Age Coders make learning coding so simple that kids love it. The teachers explain complex concepts clearly with practical exercises and interactive content."
Ria Mukherjee
Parent
★★★★★
"Modern Age Coders has been a game-changer for me. I struggled to grasp IT concepts and coding before joining, but their classes transformed everything. I can now confidently write complex programs with ease."
Samriddha Mondal
Student
★★★★★
"One of the most wonderful education centres out there. Education is not limited to school syllabus but focuses on skill development."
Vansh Agarwal
Student
★★★★★
"My child Dhairya is really enjoying the Modern Age Coders classes. This is his first online class and he eagerly looks forward to it. I can already see his improvement, and the teachers are very cooperative."
Sonam Oswal
Parent of Dhairya
★★★★★
"Modern Age Coders have wonderful teachers who teach in a clear, easy and practical way. The teacher boosts students' confidence and inspires them to learn without hesitation."
Sonu Goyal
Parent
★★★★★
"I highly recommend this computer coding class! The teachers are incredibly knowledgeable and passionate about coding."
Ritu Kedia
Parent
Questions students ask
Under the Common Core, high school statistics covers interpreting categorical and quantitative data, making inferences and justifying conclusions, and conditional probability, with expected value and decision-making for advanced courses. Plots, measures of center and spread, two-way tables, regression and simulation run through all of it.
No. AP Statistics is a College Board course with its own exam. A non-AP statistics course or unit follows the state standards and the school's own tests, and is usually less formal about inference. We have a separate page for AP Statistics tutoring.
It is different rather than harder. Algebra usually has one correct answer, while statistics asks students to choose a method and justify a conclusion about messy data. Students who are strong at procedures sometimes find that shift uncomfortable at first.
It is a probability worked out inside a smaller group. The Common Core defines the probability of A given B as P(A and B) divided by P(B): out of the outcomes where B happens, what fraction also have A. Reading a two-way table row by row is the easiest way to see it.
Usually because the answer gives a number without context. A full interpretation names the variables, the units and the direction, for example that each extra hour goes with about 2.4 more points. We practise those sentences every lesson.
That depends on the school. The Common Core expects technology for some tasks, such as computing a correlation coefficient and estimating areas under the normal curve with calculators, spreadsheets or tables. We also use short Python programs for simulation.
We can teach the method: how to frame a question, collect data fairly, choose plots and write a conclusion. We do not collect data for the student, write the report or edit it for a grade. The work must be the student's own.
Our own practice set is on this page with answers. The student's textbook and school materials are the next place to look, since tests follow them. We do not reproduce state test items or publisher questions.
Weekdays or weekends, flexible: choose your batch, or for a very personalised plan choose 1-on-1 at your convenience, weekend mornings or weekdays.
No. Modern Age Coders is an independent online school. We teach from the published standards and each student's school course, and we are not affiliated with any state, district or publisher.
Elsewhere on this site
Other math help for high school students and families.
For students on the AP route.
Functions and data models together.
The standards behind school math.
A year when statistics units appear.
Statistics carried into code.
How tutoring is usually priced.
Part of the guide: US math placement and college readiness tests
More guides: US state math tests by state · US gifted and selective school tests · Homeschool and school math curricula guide · US math and coding competitions guide
Start here
Tell us the course name, the unit your child is on and the date of the next test. The teacher starts with one plot and one two-way table to see how your child reasons.
Read how our classes work, or browse all our courses.
WhatsApp us · +91 91233 66161 · connect@modernagecoders.com
Our teachers teach live from India, with after-school slots across US time zones from Eastern to Pacific. A WhatsApp message is the quickest way to reach us.
A priority demo is a full class of about 45 to 60 minutes. After the class the mentor sends a written skill report and a personal learning roadmap on WhatsApp. If you enrol, the demo fee is adjusted against your first month's fee. Share your demo Order ID with us on WhatsApp and we take it off.
Book a priority demo