MDMT / G12 / 01
Ontario Grade 12 University Math
Advanced Functions and Calculus and Vectors, the other two Grade 12 courses.
Open the syllabusOntario · Grade 12 · MDM4U Data Management
Data Management is the Grade 12 math course that ends with a project of the student’s own: a question, a data set, and a report defended in front of the class. Before that come counting, probability, distributions and statistics, each with its own traps. This page sets out MDM4U from the 2007 curriculum, solves two probability problems, runs a short Python investigation on real Toronto weather data, and gives twelve practice questions of ours. We teach alongside the school course and do not grant Ontario credits; the credit comes from the student’s school.
Teaching live online since 2020 · 10,000+ students · Statistics, probability and the culminating investigation
In brief
MDM4U is Mathematics of Data Management, Ontario’s Grade 12 university-preparation course in counting, probability, probability distributions and statistics, ending in a culminating investigation. It follows MCR3U or MCF3M. Modern Age Coders teaches MDM4U live online, in a batch or one to one, through our course Statistics and Probability: Data to Hypothesis Testing.
Learn it with a teacher
The first matches MDM4U’s statistics and probability closely. The second goes deeper, and the third adds the programming that makes a culminating investigation easier.
MDMT / 01
Counting, distributions, sampling, correlation and regression: the core of MDM4U, taught live.
Open the syllabus →
MDMT / 02
Inference and study design in more depth, for students heading into social science or business.
Open the syllabus →
MDMT / 03
Python for cleaning, summarising and charting a real data set, the skills behind the project below.
Open the syllabus →The Ontario curriculum
MDM4U’s course description reads: “This course broadens students’ understanding of mathematics as it relates to managing data.” Students “carry out a culminating investigation that integrates statistical concepts and skills”. Unlike the other Grade 12 university math courses, it has five strands, and the fifth is the investigation itself.
| Strand | From the overall expectations | In class (our reading) |
|---|---|---|
| A. Counting and Probability | solve problems involving “the probability of an event or a combination of events for discrete sample spaces”, and apply “permutations and combinations” | Sample spaces, complements, independence and conditional probability, then counting with factorials, permutations and combinations |
| B. Probability Distributions | discrete distributions with “expected values”; continuous distributions, standard deviations and “key features of the normal distribution” | Uniform, binomial and hypergeometric distributions, then the normal curve and z-scores |
| C. Organization of Data for Analysis | the role of data and “the variability inherent in data”; “the characteristics of a good sample, some sampling techniques, and principles of primary data collection” | Types of data, sampling methods, kinds of bias, and designing a fair survey |
| D. Statistical Analysis | draw conclusions from “one-variable data using numerical and graphical summaries” and from two-variable data; applications in “the media and the advertising industry” | Mean, median, spread and boxplots; scatter plots, correlation and regression; reading statistics in the news critically |
| E. Culminating Data Management Investigation | “design and carry out a culminating investigation”, then communicate the findings and critique the investigations of others | A project with a question, data, analysis, a written report and a short presentation |
Strand B states the empirical rule word for word: “approximately 68% of the data values are within one standard deviation of the mean and approximately 95% of the data values are within two standard deviations of the mean”. It also defines a z-score as “the positive or negative number of standard deviations from the mean”. Both feed directly into our Python project below, where the rule is tested on real data and partly fails.
The binomial and hypergeometric distributions are told apart by one condition: the curriculum ties the binomial to “(e.g., independent trials)” and the hypergeometric to “(e.g., dependent trials)”. Choosing the right one is often the whole question, as our first worked problem shows.
Strand C names the sampling methods students must compare, “simple random, systematic, stratified, convenience, voluntary”, and the biases they must recognise: “response bias, measurement bias, non-response bias, sampling bias”. It also asks for “the need for randomization, replication, and control in experimental studies”.
Strand D brings this to the news. Students interpret a statistic that is “accurate to within 3 percentage points, 19 times out of 20”, a phrasing often seen in published polls, and they use residuals to “determine the fit of an individual data point to the linear model”.
The description says that students “planning to enter university programs in business, the social sciences, and the humanities will find this course of particular interest.” The programme overview adds that it “is designed to satisfy the prerequisites for a number of university programs that may include statistics courses, such as those found in the social sciences and the humanities”.
It is also the Grade 12 university course with the widest entry: MCF3M students can take it as well as MCR3U students.
The course page lists “Functions, Grade 11, University Preparation, or Functions and Applications, Grade 11, University/College Preparation”, and the ministry’s online course record gives the same text with the year 2007.
The programme overview names spreadsheets and “Fathom, a ministry-licensed dynamic statistical program.” We teach the same ideas with whatever tool the school uses, and with Python for students who want to code their investigation. MDM4U is one credit, with the usual split of term work and a final evaluation.
Source: The Ontario Curriculum, Grades 11 and 12: Mathematics (2007), programme overview and MDM4U pages, read 22 October 2026, and the MDM4U record on the ministry’s curriculum website, checked the same day. Expectations that use symbols are described, not quoted. The ministry has no involvement with this page.
Where students lose marks
Data Management has a reputation as the gentler Grade 12 math course. The algebra is lighter, but the reasoning is subtle, and a wrong first decision sinks an otherwise perfect solution. These are the decisions we see go wrong most.
| Decision | The common slip | The question to ask first |
|---|---|---|
| Permutation or combination? | Using a permutation when order does not matter, which overcounts | If I swap two chosen items, is it a different outcome? |
| Direct count or complement? | Adding up many cases for an “at least one” question | Is the opposite event a single, easy case? |
| Independent or mutually exclusive? | Treating the two words as the same idea | Can both happen at once? Does one change the other’s probability? |
| Binomial or hypergeometric? | Using the binomial when items are drawn without replacement | Does each trial change the chances of the next? |
| Is a normal model fair? | Using z-scores on data that is skewed or has two humps | What does the histogram look like? |
| Correlation or cause? | Reading a high r as proof that one variable drives the other | Could a third variable move both? |
In MDM4U, “at least”, “given that” and “without replacement” each change the method. We have students underline them before writing a single number.
A tree diagram or a two-way table makes conditional probability visible. Formulas come after the picture makes sense, not before.
A correlation of 0.97 is a number. Saying what it does and does not show is the answer the marker is looking for.
Worked problems, ours
We wrote both problems for this page at MDM4U test level, one on counting and one on distributions. The point of each is the choice of method. Every probability was checked by computer.
Problem 1, counting and probability. A math club has 7 Grade 11 students and 5 Grade 12 students. A team of 4 is chosen at random. (a) What is the probability the team includes at least one Grade 12 student? (b) What is the probability it has exactly two of each grade?
Problem 2, binomial and normal. A student guesses every answer on a 20-question multiple-choice quiz with four options per question. What is the probability of 8 or more correct? Compare the exact binomial answer with a normal approximation.
| Method | Calculation | P(8 or more correct) |
|---|---|---|
| Exact binomial | Sum of C(20, k)(0.25)k(0.75)20 − k, k = 8 to 20 | 0.1018 |
| Normal, with continuity correction | P(Z ≥ 1.29) | 0.0984 |
| Normal, without correction | P(Z ≥ 1.55) | 0.0607 |
A Python investigation, ours
This short investigation is ours, and it uses the same steps as a culminating investigation: a question, a reliable secondary source, cleaning, one-variable and two-variable analysis, and honest conclusions. The data is Environment and Climate Change Canada’s daily record for the Toronto City station, which anyone can download free.
The questions. (1) What did a typical daily high look like in Toronto in 2025, and does a normal model describe the year? (2) Does a single month fit the normal model better? (3) How well does a day’s high temperature predict its low?
# MDM4U mini investigation (ours): Toronto City daily temperatures, 2025.
# Data Source: Environment and Climate Change Canada (station TORONTO CITY, climate ID 6158355).
import csv
import statistics as st

with open("toronto-city-31688-2025-daily.csv", encoding="utf-8-sig") as f:
    rows = list(csv.DictReader(f))

def col(name):                      # header text starts "Max Temp (" etc.
    return next(k for k in rows[0] if k.startswith(name))

MAX, MIN = col("Max Temp ("), col("Min Temp (")
days = [r for r in rows if r[MAX] != "" and r[MIN] != ""]   # drop missing (flag M)
highs = [float(r[MAX]) for r in days]
lows = [float(r[MIN]) for r in days]
print("days in file:", len(rows), " usable:", len(days))

# 1. One variable: the daily high
q1, q2, q3 = st.quantiles(highs, n=4, method="inclusive")
mean, sd = st.mean(highs), st.stdev(highs)
print(f"high: mean {mean:.1f}, median {q2:.1f}, sd {sd:.1f}")
print(f"quartiles {q1:.1f} / {q3:.1f}, IQR {q3 - q1:.1f}")
print(f"lowest high {min(highs):.1f}, highest high {max(highs):.1f}")
for k in (1, 2):
    share = sum(1 for h in highs if abs(h - mean) <= k * sd) / len(highs)
    print(f"within {k} sd of the mean: {share:.1%}")

for lo in range(-10, 40, 10):       # a text histogram, 10-degree bins
    n = sum(1 for h in highs if lo <= h < lo + 10)
    print(f"{lo:>4} to {lo + 10:<3} {n:>3} " + "#" * (n // 4))

# 2. One month: is July closer to normal?
july = [float(r[MAX]) for r in days if r["Month"] == "07"]
jm, js = st.mean(july), st.stdev(july)
j1 = sum(1 for h in july if abs(h - jm) <= js) / len(july)
j2 = sum(1 for h in july if abs(h - jm) <= 2 * js) / len(july)
print(f"July: n {len(july)}, mean {jm:.1f}, sd {js:.1f}, within 1 sd {j1:.1%}, within 2 sd {j2:.1%}")
print(f"hottest July day {max(july):.1f}, z = {(max(july) - jm) / js:.2f}")
for m in ("01", "04", "07", "10"):  # how spread out is each season?
    x = [float(r[MAX]) for r in days if r["Month"] == m]
    print(f"month {m}: mean {st.mean(x):5.1f}, sd {st.stdev(x):.1f}")

# 3. Two variables: does the high predict the low?
r = st.correlation(highs, lows)
slope, intercept = st.linear_regression(highs, lows)
print(f"r = {r:.3f}, r squared = {r * r:.3f}")
print(f"low = {slope:.3f} x high + ({intercept:.2f})")
print(f"predicted low on a 25.0 degree day: {slope * 25 + intercept:.1f}")
Written and run with Python 3.13. The statistics module’s stdev is the sample standard deviation, often written s. Quartiles use the inclusive method; a spreadsheet or Fathom may give slightly different quartiles, and a report should name the method used.
days in file: 365  usable: 359
high: mean 13.8, median 13.7, sd 11.3
quartiles 3.9 / 23.8, IQR 19.9
lowest high -9.8, highest high 36.5
within 1 sd of the mean: 58.8%
within 2 sd of the mean: 99.4%
 -10 to 0    47 ###########
   0 to 10   96 ########################
  10 to 20   77 ###################
  20 to 30  115 ############################
  30 to 40   24 ######
July: n 31, mean 29.2, sd 2.9, within 1 sd 58.1%, within 2 sd 100.0%
hottest July day 33.3, z = 1.42
month 01: mean  -1.1, sd 3.7
month 04: mean  12.6, sd 6.3
month 07: mean  29.2, sd 2.9
month 10: mean  16.6, sd 5.5
r = 0.968, r squared = 0.936
low = 0.866 x high + (-6.03)
predicted low on a 25.0 degree day: 15.6
| Data set | Mean high | Standard deviation | Within 1 SD | Within 2 SD | Normal model predicts |
|---|---|---|---|---|---|
| All of 2025, 359 days | 13.8°C | 11.3°C | 58.8% | 99.4% | about 68% and 95% |
| July 2025, 31 days | 29.2°C | 2.9°C | 58.1% | 100.0% | about 68% and 95% |
The year does not fit a normal model. Only 58.8% of days fall within one standard deviation of the mean, well short of 68%, and 99.4% fall within two. The text histogram explains why: there is one hump from 0 to 10°C and another from 20 to 30°C. A year is a mixture of seasons, and a mixture of two groups is flatter than a bell.
The mean (13.8°C) and median (13.7°C) almost agree, so the data is roughly symmetric. Symmetric is not the same as normal; that is the main lesson of this step.
July is narrower, with a standard deviation of only 2.9°C, but 31 values is a small sample, and its shares within one and two standard deviations (58.1% and 100.0%) still do not match the bell. The hottest July day, 33.3°C, has a z-score of only 1.42. A student should report that the normal model is not supported here rather than force it.
The four sample months add a finding the question did not ask for: spread is largest in April (6.3°C) and October (5.5°C), and smallest in July (2.9°C). Spring and autumn days are the least predictable.
The correlation between each day’s high and low is r = 0.968, very strong and positive, and r squared = 0.936: about 94% of the variation in daily lows is explained by the linear model on the highs. The regression line is low = 0.866 × high − 6.03, so a 25.0°C day predicts a low of about 15.6°C.
The prediction is safe inside the range of the data (highs from −9.8 to 36.5°C in this file). Using the line for a 45°C day would be extrapolation, and the report should say so.
A high temperature does not cause a low temperature. Both are driven by the same things: the season, the air mass over the city, cloud cover. In MDM4U’s language this is a common-cause relationship, and it is the sentence that turns a correct number into a full-mark interpretation.
Limitations belong in the report too: one station, one year, and six missing days. A follow-up could compare several years, or a lakeside station with an inland one.
Data Source: Environment and Climate Change Canada, daily data for TORONTO CITY (climate ID 6158355), 2025, downloaded 22 October 2026 from Environment and Climate Change Canada historical climate data, used under the ECCC Data Services End-use Licence (version 2.1.1, August 2026), which allows use “including for commercial purposes”. The analysis, code and conclusions are ours, and nothing here suggests ECCC endorses them.
The culminating investigation
Strand E asks students to “pose a significant problem of interest”, carry out the study, and present it. A footnote allows the work to be done “by addressing a single problem on probability and statistics or by addressing two smaller problems, one on probability and the other on statistics.” Schools set their own format, so start from the teacher’s rubric. The plan below is ours.
We help students choose a workable question, find a source, plan the analysis, learn the tools and check their reasoning. We read drafts and ask the questions a marker would ask.
We do not write the report or run the analysis for the student. The investigation is assessed as the student’s own work, and it is also the part of the course where they learn the most.
Use whatever the teacher expects. A spreadsheet is fine for a few hundred rows; Python, as above, handles thousands and makes every step repeatable. Students who already code often find a script easier to explain than a chain of spreadsheet formulas.
Whichever tool is used, the report should show the method in words. A marker cannot award credit for a number whose origin is hidden.
Practice, ours
Our own questions, written for this page and checked with Python. They follow the strands in order. Answers with reasons come straight after.
Answers, ours
Most MDM4U marks are for the method and the interpretation, so each answer gives both.
After Grade 12
MDM4U appears on admission pages in a different way from Advanced Functions or Calculus and Vectors. These listings are copied from the universities’ own pages.
| Program | How MDM4U is listed | Other math on the listing |
|---|---|---|
| University of Toronto Mississauga, Computer Science (TMX) | MDM4U, marked “Recommended” | MHF4U and MCV4U |
| University of Toronto Scarborough, Psychology (TPS, TXF) | “One Math (Calculus & Vectors / Advanced Functions / Mathematics of Data Management)”, marked Recommended | Any one of the three |
| University of Toronto Mississauga, Psychology (TMP) | Not listed | MHF4U |
| University of Waterloo, Accounting and Financial Management | A recommended course, with Principles of Financial Accounting | Advanced Functions and Calculus and Vectors, each with a 75% minimum |
For many programs, MDM4U strengthens an application without replacing Advanced Functions or Calculus and Vectors. The same psychology program can list MDM4U as one acceptable math option on one campus and ask for Advanced Functions on another, so students should read the listing for the exact campus and program.
For social science and humanities programs that use statistics, the curriculum’s own description makes MDM4U the natural fit, and its first-year statistics courses will feel familiar.
Many students take MDM4U alongside MHF4U and MCV4U. The courses share little content, so the load is in the volume of work rather than overlapping ideas, and the culminating investigation needs time blocked out weeks ahead.
Requirements change between cycles, so check each program’s page in the autumn of Grade 12. We are not connected with either university.
Sources, read 22 October 2026: University of Toronto, Computer Science; University of Toronto, Psychology; University of Waterloo, Accounting and Financial Management.
Credit and timing
When a family searches for MDM4U online, it is worth separating two things: getting the credit, and understanding the course. We do the second.
An MDM4U credit is granted by the school or program that teaches and evaluates it, including a student’s own school, a board summer program, or a private school that is permitted to grant Ontario credits. Modern Age Coders is a tutoring service; we teach alongside the course and do not grant Ontario credits.
That also means we never submit work for a student or contact their school about marks. Our role is the explanation, the practice and the feedback on drafts.
Three points in the course draw the most requests: the counting unit, where permutations and combinations first collide; the move to distributions and z-scores; and the weeks of the culminating investigation.
A compressed summer MDM4U course leaves little time for the investigation. Starting the question and the data search before the course begins makes a real difference.
We book classes in Eastern time for most of Ontario, which is UTC-4 until the clocks fall back on 1 November 2026 and UTC-5 until they spring forward on 14 March 2027. Our teachers work on India time (UTC+5:30), 9 hours 30 minutes ahead of Eastern time in summer and 10 hours 30 minutes ahead in winter. If you are in a part of northwestern Ontario on another clock, tell us your local time.
Where your teen is now
Stages we see in our own MDM4U students. They describe reasoning, not marks.
| Stage | What it sounds like |
|---|---|
| 1. Formula hunter | “Which formula is this one?” asked before reading the question twice |
| 2. Method chooser | Decides between permutation and combination, binomial and hypergeometric, with a reason |
| 3. Model checker | Looks at the shape of the data before using a normal model or a line |
| 4. Investigator | Poses a question, cleans data openly, and states what the conclusions cannot show |
Ask your teen to explain the difference between “independent” and “mutually exclusive” in their own words. It is a quick test of whether the probability unit has landed.
Watch the calendar for the culminating investigation. It is spread over weeks, and the students who struggle are usually the ones who start late.
Underline the words that choose the method: at least, given that, without replacement, in order.
Draw the histogram before you use the normal distribution. Our Toronto data shows how often the bell does not fit.
The catalogue
Live online with one regular teacher for each course, taught to a batch or to a single student.
MDMT / G12 / 01
Advanced Functions and Calculus and Vectors, the other two Grade 12 courses.
Open the syllabusMDMT / G12 / 02
Algebra and functions support across Grades 9 to 12.
Open the syllabusMDMT / G12 / 03
Includes data analysis questions, for US applications.
Open the syllabusMDMT / DAT / 01
The language used in the investigation above.
Open the syllabusMDMT / DAT / 02
Visual data analysis and machine learning without code.
Open the syllabusMDMT / DAT / 03
Asking questions of a database, from the first query.
Open the syllabusMDMT / NXT / 01
Excel, SQL, Python and dashboards for first-year students.
Open the syllabusMDMT / NXT / 02
Statistics and linear algebra behind machine learning.
Open the syllabusMDMT / NXT / 03
Where probability and data meet real models.
Open the syllabusHow classes run
Weekdays or weekends, flexible: choose your batch, or for a very personalised plan choose 1-on-1 at your convenience, weekend mornings or weekdays.
Weekdays
After school on Eastern time, set by the batch you choose.
Weekends
Eastern time mornings, handy in investigation weeks.
1-on-1
Booked around tests, project checkpoints and the final.
Units taught as the class meets them.
The choice of method, said out loud.
Open government data, used properly.
Questions a marker would ask.
Spreadsheet, Fathom or Python.
Batches of fifteen to twenty, or one to one.
Student work
Students who learn to code with us build projects like these; several started from a data question. The student labs page has more.

AI and ML
An AI nutrition coach that reads what you eat and works you toward a target.

AI and ML
A chatbot that answers mathematics and programming questions, built and deployed by a student.

AI and ML
An assistant that helps a young person recognise unsafe situations online.
Web app
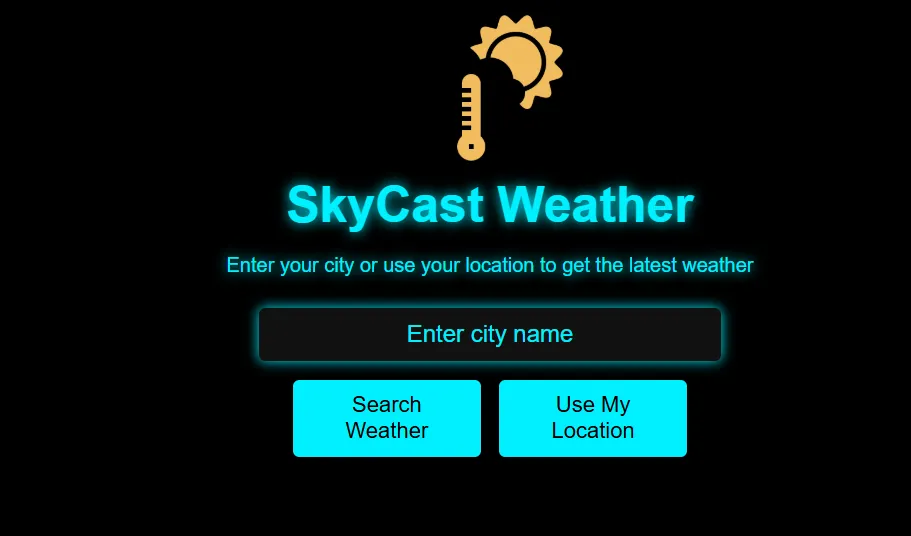
A weather forecasting site with live conditions for any location.
Fees
The first class is on us. Ongoing classes come as eight live sessions a month for a monthly fee, shown with its currency code, and you can stop at the end of any month with no term commitment.
Free first class
Free
no card required
Group batch
$100 USD
a month, eight live classes
One to one
$150 USD
a month, eight live classes
What families say
Reviews left on Google by families and students, as they wrote them.
★★★★★
"The one step solution for my son. Modern Age Coders make learning coding so simple that kids love it. The teachers explain complex concepts clearly with practical exercises and interactive content."
Ria Mukherjee
Parent
★★★★★
"Modern Age Coders has been a game-changer for me. I struggled to grasp IT concepts and coding before joining, but their classes transformed everything. I can now confidently write complex programs with ease."
Samriddha Mondal
Student
★★★★★
"One of the most wonderful education centres out there. Education is not limited to school syllabus but focuses on skill development."
Vansh Agarwal
Student
★★★★★
"My child Dhairya is really enjoying the Modern Age Coders classes. This is his first online class and he eagerly looks forward to it. I can already see his improvement, and the teachers are very cooperative."
Sonam Oswal
Parent of Dhairya
★★★★★
"Modern Age Coders have wonderful teachers who teach in a clear, easy and practical way. The teacher boosts students' confidence and inspires them to learn without hesitation."
Sonu Goyal
Parent
★★★★★
"I highly recommend this computer coding class! The teachers are incredibly knowledgeable and passionate about coding."
Ritu Kedia
Parent
Questions from Ontario families
MDM4U is Mathematics of Data Management, Grade 12, University Preparation, in Ontario's 2007 senior mathematics curriculum. It has five strands: counting and probability, probability distributions, organization of data for analysis, statistical analysis, and a culminating data management investigation.
No. We teach alongside the student's school course and do not grant Ontario credits. The credit is granted by the school or program that delivers and evaluates MDM4U. We provide teaching, practice and feedback.
Functions, Grade 11, University Preparation (MCR3U), or Functions and Applications, Grade 11, University/College Preparation (MCF3M). Both are printed on the MDM4U course page of the 2007 curriculum.
It uses less algebra, but it is not automatically easier. The difficulty is in choosing the right method, such as permutation or combination, binomial or hypergeometric, and in interpreting results in words. The culminating investigation also takes sustained work over several weeks.
It is the fifth strand: students pose a significant problem, gather and analyse data, draw conclusions with their limitations, write a report and present it. The curriculum allows one problem on probability and statistics or two smaller problems, one on each. Schools set the format and rubric.
No. We help choose a question, find a reliable data source, plan the analysis, learn the tools and review drafts, but the work and the writing stay the student's own. That is how it is assessed, and it is where the learning happens.
Some recommend it rather than require it. On 22 October 2026, the University of Toronto Mississauga Computer Science listing marked MDM4U as recommended, and the Scarborough Psychology listing accepted it as one of three recommended math options. Always check the exact program and campus.
The course is about the mathematics, not a tool. Schools commonly use spreadsheets or Fathom. Python works well for a culminating investigation with a large data set, and we teach it to students who want to use it, if their teacher accepts it.
Weekdays or weekends, flexible: choose your batch, or for a very personalised plan choose 1-on-1 at your convenience, weekend mornings or weekdays. Ontario families book in Eastern time; the clocks change on 1 November 2026 and 14 March 2027.
The first class is free. Then classes are paid monthly, eight live sessions a month, and you can stop after any month. The fees section of this page shows the current amount for a batch and for one-to-one lessons.
Elsewhere on this site
More for Ontario students working with data and probability.
All our pages for Canadian families.
Math tutoring through the Canadian grades.
Inference and study design, one to one.
The ideas under strand A, from scratch.
The tools behind our Toronto investigation.
Programming classes for Ontario students.
Help in the final year of high school.
How a live class with us runs.
Start here
Tell us where your teen is in MDM4U: the current unit, the next test, or the stage of the culminating investigation. The first class starts there.
Want to look around first? How we teach describes a class, and our Python for data science page shows the kind of analysis used above.
WhatsApp us · +91 91233 66161 · connect@modernagecoders.com
All classes are live online with teachers in India: no travel, no home visits, just a video call. Ontario families usually reach us fastest on WhatsApp.
A priority demo is a full class of about 45 to 60 minutes. After the class the mentor sends a written skill report and a personal learning roadmap on WhatsApp. If you enrol, the demo fee is adjusted against your first month's fee. Share your demo Order ID with us on WhatsApp and we take it off.
Book a priority demo