HSCS / I / 01
Python for teens
The usual first language.
Open the syllabusUnited States · Public high schools · Code.org 2025 data
Can a high school student in your state take a computer science class at their own school? The answer depends heavily on where they live. In the latest national figures, 60% of public high schools offer foundational computer science, ranging from every high school in Arkansas and Maryland to about a third in Alaska and Minnesota. This page gives every state’s count, the share of students who actually enroll, and how access has moved since 2019, with every figure tied to its source year.
Live classes since 2020 · 10,000+ students · CS for students whose school has none
In short
In Code.org (2025), 2025 State of AI + CS Education, 14,805 of 24,405 US public high schools, or 60%, offer foundational computer science, but only 871,490 of 14,364,449 high school students, about 6.1%, were enrolled, a figure based on the states that report participation (42 in 2024 to 2025). Arkansas (301 of 301) and Maryland (219 of 219) report every high school offering CS; Alaska (34.2%) and Minnesota (34.4%) report the lowest shares. Modern Age Coders teaches this live online for US students, in a batch or one to one, and the first class is free.
If your school has no CS class
Chosen for students in the four in ten high schools without a foundational CS course.
HSCS / 01
Ages 13 to 18. The language most first CS courses use.
Open the syllabus →
HSCS / 02
Grades 9 to 12. The AP course content, even without a school class.
Open the syllabus →
HSCS / 03
High school. Java and the AP exam, taught live.
Open the syllabus →Every state and DC
Each state’s most recent year in the 2025 data. Some states last reported for 2023 to 2024, others for 2024 to 2025, so the year column matters when you compare two states.
| State | School year | High schools offering CS | Share |
|---|---|---|---|
| Alabama | 2024 to 2025 | 351 of 382 | 91.9% |
| Alaska | 2024 to 2025 | 89 of 260 | 34.2% |
| Arizona | 2023 to 2024 | 278 of 643 | 43.2% |
| Arkansas | 2024 to 2025 | 301 of 301 | 100.0% |
| California | 2023 to 2024 | 1,325 of 2,282 | 58.1% |
| Colorado | 2023 to 2024 | 344 of 519 | 66.3% |
| Connecticut | 2023 to 2024 | 173 of 207 | 83.6% |
| Delaware | 2024 to 2025 | 36 of 57 | 63.2% |
| District of Columbia | 2024 to 2025 | 27 of 45 | 60.0% |
| Florida | 2023 to 2024 | 463 of 1,192 | 38.8% |
| Georgia | 2024 to 2025 | 399 of 495 | 80.6% |
| Hawaii | 2024 to 2025 | 46 of 69 | 66.7% |
| Idaho | 2024 to 2025 | 117 of 266 | 44.0% |
| Illinois | 2023 to 2024 | 418 of 721 | 58.0% |
| Indiana | 2023 to 2024 | 368 of 414 | 88.9% |
| Iowa | 2024 to 2025 | 306 of 355 | 86.2% |
| Kansas | 2023 to 2024 | 153 of 404 | 37.9% |
| Kentucky | 2024 to 2025 | 270 of 358 | 75.4% |
| Louisiana | 2024 to 2025 | 144 of 366 | 39.3% |
| Maine | 2024 to 2025 | 72 of 123 | 58.5% |
| Maryland | 2024 to 2025 | 219 of 219 | 100.0% |
| Massachusetts | 2023 to 2024 | 325 of 400 | 81.2% |
| Michigan | 2023 to 2024 | 674 of 1,228 | 54.9% |
| Minnesota | 2023 to 2024 | 275 of 799 | 34.4% |
| Mississippi | 2024 to 2025 | 204 of 234 | 87.2% |
| Missouri | 2023 to 2024 | 310 of 551 | 56.3% |
| Montana | 2024 to 2025 | 66 of 172 | 38.4% |
| Nebraska | 2023 to 2024 | 141 of 276 | 51.1% |
| Nevada | 2023 to 2024 | 143 of 146 | 97.9% |
| New Hampshire | 2024 to 2025 | 89 of 95 | 93.7% |
| New Jersey | 2023 to 2024 | 377 of 437 | 86.3% |
| New Mexico | 2023 to 2024 | 126 of 235 | 53.6% |
| New York | 2023 to 2024 | 674 of 1,360 | 49.6% |
| North Carolina | 2024 to 2025 | 513 of 735 | 69.8% |
| North Dakota | 2023 to 2024 | 148 of 176 | 84.1% |
| Ohio | 2023 to 2024 | 635 of 1,045 | 60.8% |
| Oklahoma | 2023 to 2024 | 334 of 467 | 71.5% |
| Oregon | 2023 to 2024 | 195 of 347 | 56.2% |
| Pennsylvania | 2023 to 2024 | 530 of 684 | 77.5% |
| Rhode Island | 2023 to 2024 | 50 of 63 | 79.4% |
| South Carolina | 2024 to 2025 | 276 of 300 | 92.0% |
| South Dakota | 2023 to 2024 | 97 of 178 | 54.5% |
| Tennessee | 2024 to 2025 | 384 of 464 | 82.8% |
| Texas | 2023 to 2024 | 1,036 of 2,160 | 48.0% |
| Utah | 2024 to 2025 | 175 of 213 | 82.2% |
| Vermont | 2023 to 2024 | 33 of 55 | 60.0% |
| Virginia | 2023 to 2024 | 229 of 335 | 68.4% |
| Washington | 2024 to 2025 | 396 of 774 | 51.2% |
| West Virginia | 2024 to 2025 | 94 of 121 | 77.7% |
| Wisconsin | 2023 to 2024 | 318 of 585 | 54.4% |
| Wyoming | 2024 to 2025 | 59 of 92 | 64.1% |
Suggested citation: Code.org (2025). 2025 State of AI + CS Education. Figures from the raw data, Most Recent Access Data tab; shares rounded to one decimal by us from the published counts. North Dakota’s row includes cybersecurity courses; under the national definition the report puts it at 53% for 2023 to 2024. The data come largely from state education agencies, with course catalogs and teacher surveys where a state does not report. We are not connected with Code.org, now called CodeAI.
Arkansas and Maryland report all of their high schools offering a foundational CS course. Nevada (143 of 146), New Hampshire (89 of 95), South Carolina (276 of 300) and Alabama (351 of 382) are all above 90%.
Four of those six, Alabama, Arkansas, Nevada and South Carolina, are also listed in the same report as states with a CS graduation requirement.
Alaska (34.2%), Minnesota (34.4%), Kansas (37.9%), Montana (38.4%), Florida (38.8%) and Louisiana (39.3%) all report fewer than four in ten high schools offering CS.
The report flags Alaska specifically: Code.org says it "encountered some challenges collecting data for Alaska this year", so treat its drop with care.
Change since 2019
Our arithmetic on the Access Percent over the Years tab: each state’s whole-number share for 2019 to 2020 against its most recent year. These are percentage points, not percent growth.
| State | 2019 to 2020 | Most recent | Change (points) |
|---|---|---|---|
| Mississippi | 48% | 87% (2024 to 2025) | +39 |
| Alabama | 57% | 92% (2024 to 2025) | +35 |
| Oklahoma | 37% | 72% (2023 to 2024) | +35 |
| Tennessee | 50% | 83% (2024 to 2025) | +33 |
| Kentucky | 45% | 75% (2024 to 2025) | +30 |
| New Hampshire | 67% | 94% (2024 to 2025) | +27 |
| Georgia | 55% | 81% (2024 to 2025) | +26 |
| Wyoming | 41% | 64% (2024 to 2025) | +23 |
| New Mexico | 32% | 54% (2023 to 2024) | +22 |
| Nevada | 77% | 98% (2023 to 2024) | +21 |
| State | 2019 to 2020 | Most recent | Change (points) |
|---|---|---|---|
| Rhode Island | 86% | 79% (2023 to 2024) | -7 |
| Delaware | 68% | 63% (2024 to 2025) | -5 |
| Virginia | 73% | 68% (2023 to 2024) | -5 |
| Massachusetts | 82% | 81% (2023 to 2024) | -1 |
| Texas | 49% | 48% (2023 to 2024) | -1 |
Nationally, the sheet shows 47% of high schools offering CS in 2019 to 2020, rising to 51%, 53%, 57.7% and then 60% in both 2023 to 2024 and 2024 to 2025. An earlier 45% for 2018 to 2019 rests on only 39 states.
The flat last two years are why the report describes access as having plateaued, except in states with a graduation requirement.
A falling share does not always mean courses were cut. If a state opens new high schools, or counts schools differently from one year to the next, the share can move without any class disappearing.
Where a figure surprises you, compare the counts as well as the percentage. The access table above gives both.
Who actually enrolls
Access means a course exists. Participation means students take it. The second number is far smaller everywhere, and nine places did not report it.
| State | Students in CS | Share |
|---|---|---|
| Alabama | 17,488 of 222,089 | 7.9% |
| Alaska | Not reported | Not reported |
| Arizona | 14,180 of 368,829 | 3.8% |
| Arkansas | 37,330 of 148,457 | 25.1% |
| California | 103,362 of 1,936,526 | 5.3% |
| Colorado | Not reported | Not reported |
| Connecticut | 12,411 of 164,921 | 7.5% |
| Delaware | Not reported | Not reported |
| District of Columbia | Not reported | Not reported |
| Florida | 20,233 of 894,064 | 2.3% |
| Georgia | 43,559 of 545,924 | 8.0% |
| Hawaii | 1,317 of 51,961 | 2.5% |
| Idaho | 1,751 of 99,336 | 1.8% |
| Illinois | 35,902 of 595,765 | 6.0% |
| Indiana | 18,146 of 325,663 | 5.6% |
| Iowa | 8,124 of 156,342 | 5.2% |
| Kansas | 3,654 of 146,266 | 2.5% |
| Kentucky | 17,236 of 201,095 | 8.6% |
| Louisiana | 5,494 of 212,772 | 2.6% |
| Maine | Not reported | Not reported |
| Maryland | 46,157 of 276,484 | 16.7% |
| Massachusetts | 23,127 of 292,428 | 7.9% |
| Michigan | Not reported | Not reported |
| Minnesota | 5,152 of 280,848 | 1.8% |
| Mississippi | 14,211 of 130,037 | 10.9% |
| Missouri | 7,804 of 273,338 | 2.9% |
| Montana | 1,655 of 45,378 | 3.6% |
| Nebraska | 4,451 of 98,972 | 4.5% |
| Nevada | Not reported | Not reported |
| New Hampshire | Not reported | Not reported |
| New Jersey | 35,941 of 408,963 | 8.8% |
| New Mexico | 3,335 of 101,654 | 3.3% |
| New York | 24,454 of 783,223 | 3.1% |
| North Carolina | 27,384 of 481,741 | 5.7% |
| North Dakota | 5,492 of 34,185 | 16.1% |
| Ohio | 15,883 of 535,556 | 3.0% |
| Oklahoma | 15,486 of 204,594 | 7.6% |
| Oregon | 12,717 of 183,221 | 6.9% |
| Pennsylvania | 19,506 of 551,996 | 3.5% |
| Rhode Island | 8,172 of 44,533 | 18.4% |
| South Carolina | 61,733 of 240,463 | 25.7% |
| South Dakota | Not reported | Not reported |
| Tennessee | 39,819 of 300,911 | 13.2% |
| Texas | 85,625 of 1,668,741 | 5.1% |
| Utah | 24,445 of 214,800 | 11.4% |
| Vermont | 766 of 24,384 | 3.1% |
| Virginia | 19,801 of 400,497 | 4.9% |
| Washington | 15,821 of 348,814 | 4.5% |
| West Virginia | 2,051 of 76,900 | 2.7% |
| Wisconsin | 8,377 of 262,627 | 3.2% |
| Wyoming | 1,938 of 29,151 | 6.6% |
Source: Code.org (2025). 2025 State of AI + CS Education, Most Recent Participation Data tab. The sheet notes that total student numbers come from the NCES Digest of Education Statistics, Table 203.04, Fall 2022, so the denominator is not always the same year as the enrollment count. Shares are rounded by us.
South Carolina (25.7%) and Arkansas (25.1%) report about one high school student in four enrolled in CS. Rhode Island (18.4%), Maryland (16.7%) and North Dakota (16.1%, including cybersecurity) follow.
At the other end, Idaho and Minnesota each report 1.8%, and Florida 2.3%.
A single elective section in a school of 2,000 students counts that school as offering CS, yet only a few dozen students may take it. Maryland shows the gap clearly: every high school offers CS, while 16.7% of students are enrolled.
For families, the lesson is that "my school offers CS" is the start of the question. Ask how many sections run, at what level, and whether they fit around other required classes.
Schools without CS
Our subtraction of the published counts: total high schools minus those offering CS. It turns a percentage into a number of buildings.
| Place | Year | High schools without CS |
|---|---|---|
| United States (national row) | Combined years | 9,600 |
| Texas | 2023 to 2024 | 1,124 |
| California | 2023 to 2024 | 957 |
| Florida | 2023 to 2024 | 729 |
| New York | 2023 to 2024 | 686 |
| Michigan | 2023 to 2024 | 554 |
| Minnesota | 2023 to 2024 | 524 |
How we worked it: Texas reports 1,036 of 2,160 high schools offering CS, so 2,160 - 1,036 = 1,124 do not. The national figure is 24,405 - 14,805 = 9,600, using the published national row rather than adding up states, because states report different years. Large states dominate the count even when their share looks middling.
Find out whether an online or dual enrollment CS course is approved for credit in your state.
Ask the school’s AP coordinator whether a student can sit an AP CS exam without taking the course there.
Outside classes build the skill even when they cannot give school credit. A portfolio of projects speaks for itself.
Check the numbers
Our example for a first data lesson: start from counts, compute each share, and sort. It shows why a published percentage is only as good as the two numbers behind it.
# offering, total: five rows typed from the access table (Code.org, 2025)
access = {
    "Alabama": (351, 382),
    "Florida": (463, 1192),
    "Maryland": (219, 219),
    "Minnesota": (275, 799),
    "Texas": (1036, 2160),
}

shares = {state: offering / total
          for state, (offering, total) in access.items()}

for state, share in sorted(shares.items(), key=lambda kv: kv[1], reverse=True):
    print(f"{state:<10} {share:6.1%}")
Output, highest first: Maryland 100.0%, Alabama 91.9%, Texas 48.0%, Florida 38.8%, Minnesota 34.4%. Each matches the table, which is the check: 1036 / 2160 = 0.4796, shown as 48.0%.
key=lambda kv: kv[1] sorts by the share, not the state name.:6.1% format multiplies by 100 and adds the percent sign.Where students start
What we usually see when a student comes to us from a high school with little or no computer science.
| Starting point | What it looks like |
|---|---|
| 1. Never coded | Curious, but no course has been available |
| 2. Self-taught basics | Some videos or block coding, no feedback |
| 3. One language | Comfortable with Python or JavaScript basics |
| 4. Exam-bound | Ready to prepare for an AP CS exam independently |
A school without CS does not close the door. Students can still learn, build projects and, where the school allows it, sit an AP exam.
What they miss is a teacher and a timetable. That is what live classes replace.
Start with one language and one project. Breadth comes later.
Keep your work in one folder or repository; it becomes your evidence when a school course is not on the transcript.
The catalogue
Live lessons with one teacher across the course, available as a group class or one to one.
HSCS / I / 01
The usual first language.
Open the syllabusHSCS / I / 02
Code that runs in a browser.
Open the syllabusHSCS / I / 03
Build and publish web pages.
Open the syllabusHSCS / II / 01
Create task and exam.
Open the syllabusHSCS / II / 02
Java and free-response practice.
Open the syllabusHSCS / II / 03
Foundations before AP CS A.
Open the syllabusHSCS / III / 01
Real datasets, real charts.
Open the syllabusHSCS / III / 02
An app with a database.
Open the syllabusHSCS / III / 03
Show your work properly.
Open the syllabusHow lessons run
Weekdays or weekends, flexible: choose your batch, or for a very personalised plan choose 1-on-1 at your convenience, weekend mornings or weekdays.
Weekdays
After the school day, in your own time zone.
Weekends
Longer blocks for project work.
1-on-1
Paced toward an AP exam date if wanted.
Live feedback on every program.
Structured units, not random videos.
Projects worth showing colleges.
AP practice when the student is ready.
Rural or urban, any state.
Fifteen to twenty, or one to one.
Student work
Work by learners who started from scratch. Browse more on student labs.
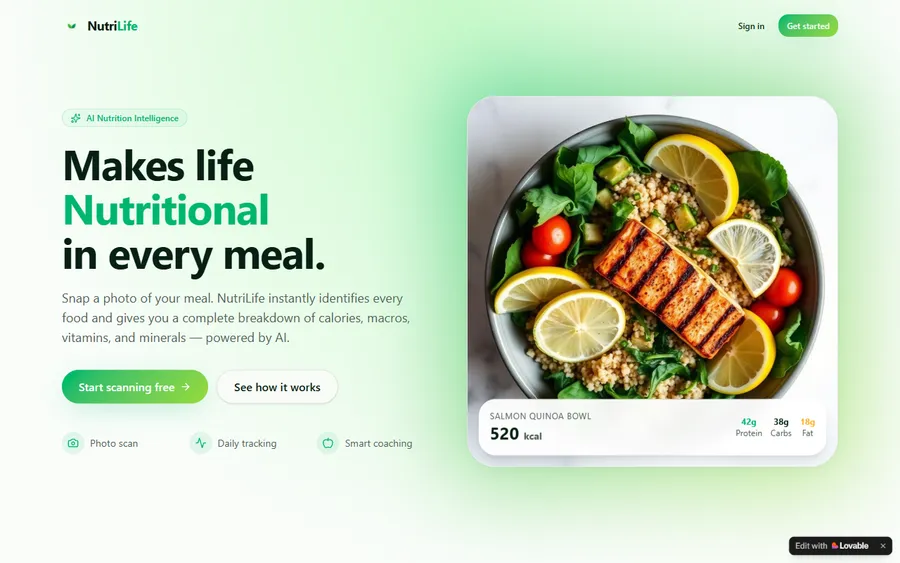
AI and ML
An AI nutrition coach that reads what you eat and works you toward a target.
AI and ML
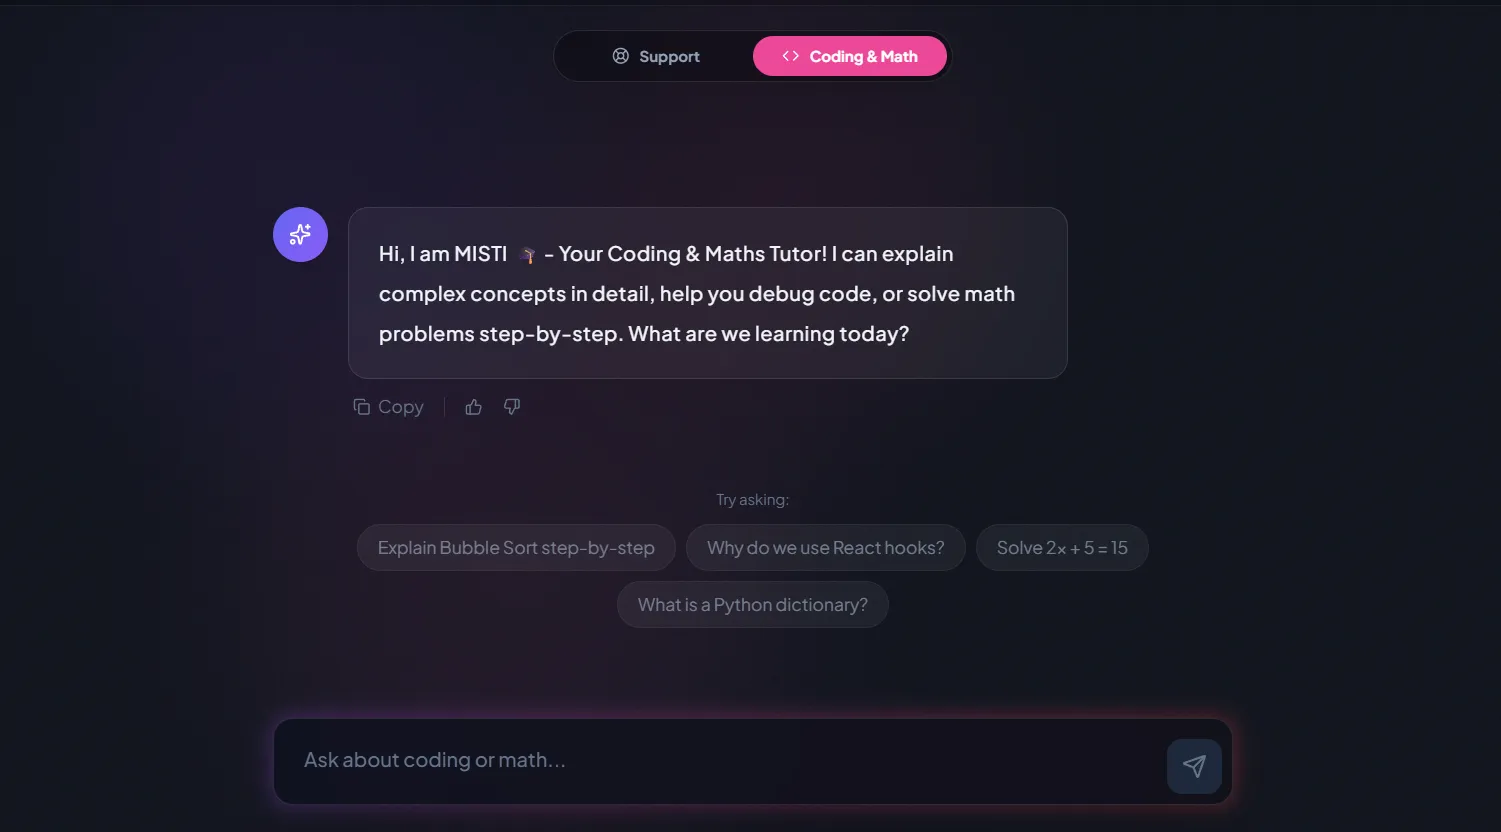
A chatbot that answers mathematics and programming questions, built and deployed by a student.
AI and ML
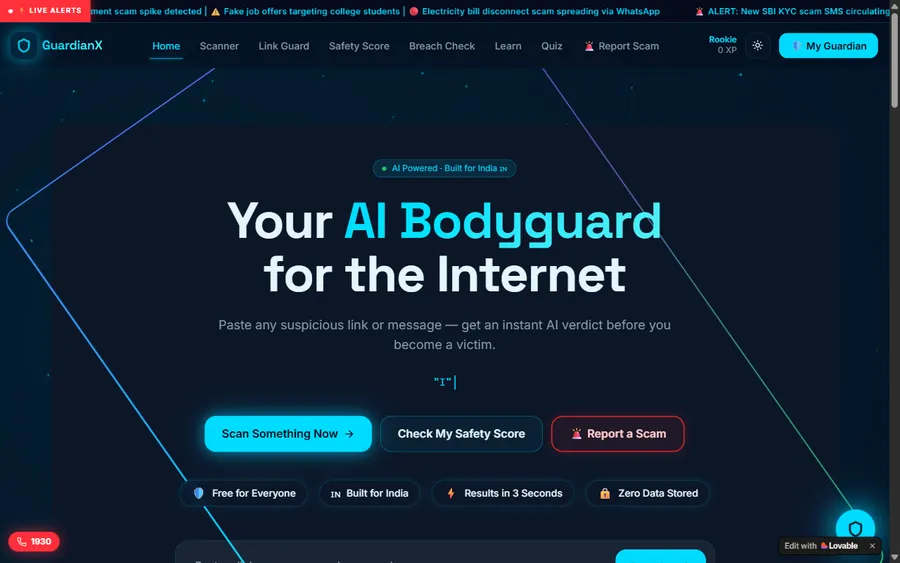
An assistant that helps a young person recognise unsafe situations online.
Web app
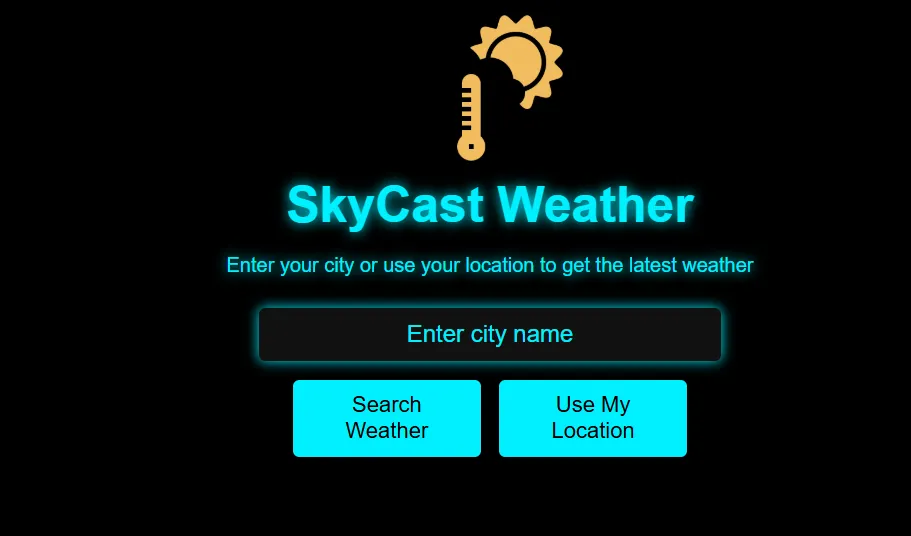
A weather forecasting site with live conditions for any location.
Fees
One monthly fee in US dollars, no annual commitment. Students without a school CS course often join for a full school year and stop after an exam.
Group batch
USD 100
a month, billed in US dollars
One to one
USD 150
a month, billed in US dollars
What families say
Google reviews from parents, quoted unchanged.
★★★★★
"The one step solution for my son. Modern Age Coders make learning coding so simple that kids love it. The teachers explain complex concepts clearly with practical exercises and interactive content."
Ria Mukherjee
Parent
★★★★★
"Modern Age Coders has been a game-changer for me. I struggled to grasp IT concepts and coding before joining, but their classes transformed everything. I can now confidently write complex programs with ease."
Samriddha Mondal
Student
★★★★★
"One of the most wonderful education centres out there. Education is not limited to school syllabus but focuses on skill development."
Vansh Agarwal
Student
★★★★★
"My child Dhairya is really enjoying the Modern Age Coders classes. This is his first online class and he eagerly looks forward to it. I can already see his improvement, and the teachers are very cooperative."
Sonam Oswal
Parent of Dhairya
★★★★★
"Modern Age Coders have wonderful teachers who teach in a clear, easy and practical way. The teacher boosts students' confidence and inspires them to learn without hesitation."
Sonu Goyal
Parent
★★★★★
"I highly recommend this computer coding class! The teachers are incredibly knowledgeable and passionate about coding."
Ritu Kedia
Parent
Questions from families
About 60%: 14,805 of 24,405 public high schools, according to Code.org (2025), 2025 State of AI + CS Education. The national figure combines each state's most recent year.
Arkansas and Maryland report every high school offering CS. Nevada, New Hampshire, South Carolina and Alabama are each above 90% in their most recent year.
Alaska (34.2%) and Minnesota (34.4%) report the lowest shares, followed by Kansas, Montana, Florida and Louisiana, all under 40%.
Nationally, 871,490 of 14,364,449 high school students, about 6.1%, counting the states that report participation. State shares range from 25.7% in South Carolina to 1.8% in Idaho and Minnesota.
Alaska, Colorado, Delaware, DC, Maine, Michigan, Nevada, New Hampshire and South Dakota had no participation figure in the most recent data. Not reported does not mean zero.
Yes, from 47% in 2019 to 2020 to 60% in the latest two years nationally. Mississippi gained the most in our calculation, 39 percentage points.
Ask the counselor about state-approved online or dual enrollment courses, ask whether an AP exam can be taken without the school course, and learn live outside school. We teach students in exactly this situation.
Weekdays or weekends, flexible: choose your batch, or for a very personalised plan choose 1-on-1 at your convenience, weekend mornings or weekdays.
Cite the original: Code.org (2025). 2025 State of AI + CS Education. Code.org publishes the raw data and states the report licence on its site.
No. Modern Age Coders is a separate online school. We quote Code.org's published data and link to it.
Elsewhere on this site
More for US students finding computer science beyond their school.
All our US pages in one place.
When there is no school AP class.
The broad AP CS course.
For younger students too.
Clubs and competitions outside class.
One state’s numbers, in depth.
State AI guidance for schools, all 50 states and DC, from the 2025 Code.org report.
Common Core and traditional math compared from the standards, with a worked example.
Computer science graduation requirements in all 50 states and DC, with state sources.
Start here
Let us know whether your school offers any computer science, and what your student has tried on their own. We will suggest a starting course and a weekly rhythm.
Before booking, see the way we teach or scan the complete catalogue.
WhatsApp us · +91 91233 66161 · connect@modernagecoders.com
There is no campus to visit: classes run live online from India, timed for American evenings and weekends. WhatsApp gets the quickest answer.
A priority demo is a full class of about 45 to 60 minutes. After the class the mentor sends a written skill report and a personal learning roadmap on WhatsApp. If you enrol, the demo fee is adjusted against your first month's fee. Share your demo Order ID with us on WhatsApp and we take it off.
Book a priority demo